Capital Market Line: From Inflation Shock to Productivity Shock
Aug 2026
View available investments in your area

Sorry, we couldn't find any results matching
Please:

Markets have navigated a series of inflationary shocks over the past few years, including Covid, tariffs, and geopolitical tensions, including most recently the closure of the Strait of Hormuz. While disagreements linger between the U.S. and Iran, neither has shown the appetite for full-fledged war. Markets remain confident in a mutual escalate-to-deescalate episode, or perhaps the two sides can still work out a middle ground. Meanwhile, we expect energy-based inflation to find a new normal as users continue fuel-switching and reducing large dependencies on fuel coming from the Strait.
At that point, we expect investors to turn their attention back toward the AI investment wave, which is on pace to be one of the largest private-sector investment booms in history. Some worry capital will be misallocated, leaving behind a debt overhang and societal disruption. Others foresee a step-up in both real growth and productivity, so that growth does not come with the burden of inflation. We think we are in the early innings of a positive productivity shock that will enhance growth and profitability and bring about disinflation over our Capital Market Line’s 5-year time frame.
Previous technological revolutions have often rewarded a narrow group of beneficiaries, at least initially. This one is no exception, but it has already begun to broaden. Open-weight models are diminishing the risk that two or three frontier labs will end up controlling the entire market. Usage is spreading to a broader set of more economical models, powering a Jevons’ paradox in which greater efficiency breeds both surging volumes and more widespread adoption. In the process, dollars are shifting away from a few frontier models focused on training future intelligence toward more economical models focused on inference. This, in turn, means the incremental AI dollar is funding a broader range of activity that includes data center construction, electrification, semiconductor fabrication, memory production, power generation, networking infrastructure and, eventually, a redesign of enterprise software and business processes. Frontier labs dependent on venture capital and circular financing are losing compute share to financially sturdier providers financed via equity and investment-grade debt. Thus, the economics of AI are trending toward sustainability.
For investors, the most pertinent issue now is where to find long-term value within the four layers of the AI stack. Semiconductors convert energy into tokens, hyperscalers convert capital expenditure into compute, foundation models convert tokens into intelligence, and applications convert that intelligence into end-user value.
With Chinese open-weight models rapidly catching up, foundation models remain well-poised to compete on their respective frontier capabilities, but their share in overall tasks is likely to diminish quickly from comprising the entire market to carrying out only the most sophisticated tasks. Over time, we also expect them to be less relevant to where tolls are collected.
The hyperscalers remain positioned at the center of enterprise adoption, which is where all the bills are paid today. They maintain trusted enterprise relationships, own secure infrastructure, provide security and compliance frameworks, and increasingly orchestrate the flow of AI workloads among models. They are paid whether workloads are routed to frontier or open-source models, and revenues are accelerating very meaningfully from wider AI usage and adoption. Still, the amount of investment required, and thus the amount of potential return after the AI wave crests, remains an area of vibrant debate.
With supply for many pieces of the AI ecosystem unable to keep up with surging demand, substantial value today is accruing to the bottlenecks, particularly memory. This is the only area China has had any initial success monetizing. Open-weight models are taking share of mind but not yet share of wallet. Over time, memory’s stranglehold over AI spend will dissipate, leaving more for all other parts of the ecosystem.
Beneath these developments lies a broader macroeconomic question: How much of the global savings glut will today’s burgeoning investment boom drain? Already, AI – capital intensive in its own right — is pulling through private investment for greater electrical capacity and data center construction, even as post-Covid governments are being called upon to do more with higher fiscal deficits and NATO partners, particularly in Europe, remilitarize. The scale of investment invites comparisons to earlier transformational periods such as the construction of the railroads, electrification, and the internet, which brought about faster growth and higher real rates. In contrast to these historical buildouts, China’s balance-sheet recession represents a large opposing force. Domestic consumption and private investment continue to wane, the domestic savings rate is surging toward 45%, and exports are ballooning. Calling a bottom to balance-sheet recessions is tough, and we’re not prepared to do so.
We’re surprised that despite their success in open-weight models, China has not entered the capital-intensive data center buildout which is where most of the monetiation of AI takes place. This seems to us like a natural step given the country’s large and growing domestic savings glut. Instead, the government has limited how much interest banks can pay depositors, in the hopes that discouraged depositors will send funds into the markets to fund AI-related start-ups like DeepSeek or Kimi and the chip-based domestic AI supply channel. To date, the migration of consumer deposits into wealth management products has only amounted to small change. Meanwhile, China continues recycling their savings into global markets, according to Brad Setser, a Senior Fellow at the Council of Foreign Relations.1
This interplay between China’s bulging savings and the rest of the world’s desire to put that savings to work helps explain one of today’s conundrums. Despite extraordinary and increasing demands for capital outside China, particularly in the U.S., today’s real rates may be settling into a trading range, though a range well off its post-GFC lows. Historically, real rates have averaged roughly 2% over long periods of time, yet as with most long-term averages, they tend to either hover well above or well below the average. For example, the historical 2% average real rate includes the period from August 1979-August 1987, when Federal Reserve Chair Paul Volcker pushed the real rate to 4.41% to squeeze inflation out of the system. Real rates then lingered above 3% for the remainder of Volcker’s term before trending down to 2% during Fed Chair Alan Greenspan’s lengthy tenure. Rates plunged below 2% at the onset of the GFC in September 2007 and stayed below 2% through March 2024, with real yields averaging 71 basis points (bps) using the implied real yields in US 10-year Treasuries. Since then, they have been hovering a bit above 2.25%. While we expect AI’s capital intensity to pressure real rates higher, we also expect China’s savings glut to continue to surge, with this delicate balance of two extremes persisting for some time.
The investment boom also has important implications for inflation. Unlike recent inflationary impulses driven by supply shortages, the AI impulse is rooted in upfront investment rather than consumption. The objective of these investments is to expand productivity, which as discussed earlier, should bring about expanded supply. The question, then, is not whether AI creates inflation today. It’s whether the 2% pace of pre-AI productivity builds towards 3%, large enough to overwhelm AI buildout inflation and create net disinflation. We believe this is highly likely. The question is: Will disinflation, as with most AI trends so far, come faster and have a larger effect than markets may have imagined possible?
AI disinflation will likely be most apparent within the services sector, which over time account for almost all inflation in developed economies. To date, most services have not been subject to as much global competition as the goods sector has been, so AI’s disinflationary potential could prove immense. While most new technologies have eventually created jobs, some also led to long periods of displacement before new industries emerged to produce these new jobs. Large-scale unemployment related to the AI transition, along with the social and political instability it would likely bring, presents AI’s largest risk over our five-year horizon, in our view. Yet, from a market perspective, it’s hard not to recognize that this would first show up as an earnings bubble, which in the context of disinflation would be quite positive for growth assets.
Such an outcome would challenge one of the dominant assumptions of the post-Keynesian era — that faster growth generates higher inflation. Instead, the next several years may increasingly resemble a supply-led environment in which supply growth outstrips demand growth and inflation moderates. That wouldn’t be new. Say’s Law, which suggests that supply creates its own demand, was postulated halfway through the Industrial Revolution, when supply did grow faster than demand, until falling prices eventually stimulated demand. The Industrial Revolution is not only a precedent for a productivity-driven growth spurt but also a lengthy period of material employment displacement and big societal changes.
This perspective appears aligned with the thoughts new Fed Chair Kevin Warsh has articulated about the likely impact of AI. A productivity shock may require lower policy rates, which is the most relevant policy tool for boosting the bottom part of the K-shaped economy. At the same time, Warsh believes that there is a balance between the two tools — interest rates and the balance sheet —with the world currently
focusing too much on rates. We hear him implying that the balance sheet/forward guidance, crisis-oriented tools have been overused and have benefitted disproportionately the top end of the K-shaped economy, without providing much relief to the bottom. The households and small businesses at the bottom of the K tend to borrow from the bank and are thus more sensitive to policy rates. Just as Volcker brought monetarism to the Fed and former Fed Chair Janet Yellen focused on labor economics, Warsh appears to be making the case for more focus on the supply side of the goods-and-services world, as well as a clearer understanding of the need for balance between the interest-rate tool and the balance sheet tool for the monetary/liquidity side. This, in turn, implies that the balance sheet needs an extended period where it expands slower than nominal GDP. In that case, policy rates might not have to rise, which would in turn rebalance the roles of the Fed’s disinflationary tools. This would have significant implications for asset allocation. Stay tuned.
Outside the United States, different thinking towards policy is also emerging. Europe has belatedly become more fiscally active. China continues nurturing state-led investment in strategic technologies, but these chosen and successful industries haven’t been meaningful employers to date. A K-shaped China has also emerged, with the private sector facing more cautious consumers who are saving more as their home values and job prospects continue to decline – all while exports boom. Perhaps free and pervasive AI can kickstart new domestic businesses in China, but at present it is hard to see what turns this around. Japan is gradually normalizing monetary policy after decades of extraordinary accommodation while becoming more fiscally active to grapple with the deflationary spillovers from China’s domestic slowdown. The United States continues to retain significant advantages in capital formation, monetizing AI, and private-sector innovation. In emerging markets, a handful of companies in Taiwan and Korea are increasingly driving the chipmaking bus, with demand threatening to overtake supply. This, too, shall pass.
Our Capital Market Line remains modestly steep, reflecting a reasonable risk/return trade-off (Exhibits 1 and 2). Despite somewhat faster growth and more disinflation coming through over the medium term, its central message remains one of high dispersion, signifying pockets of value and both more winners and more losers in the years ahead.
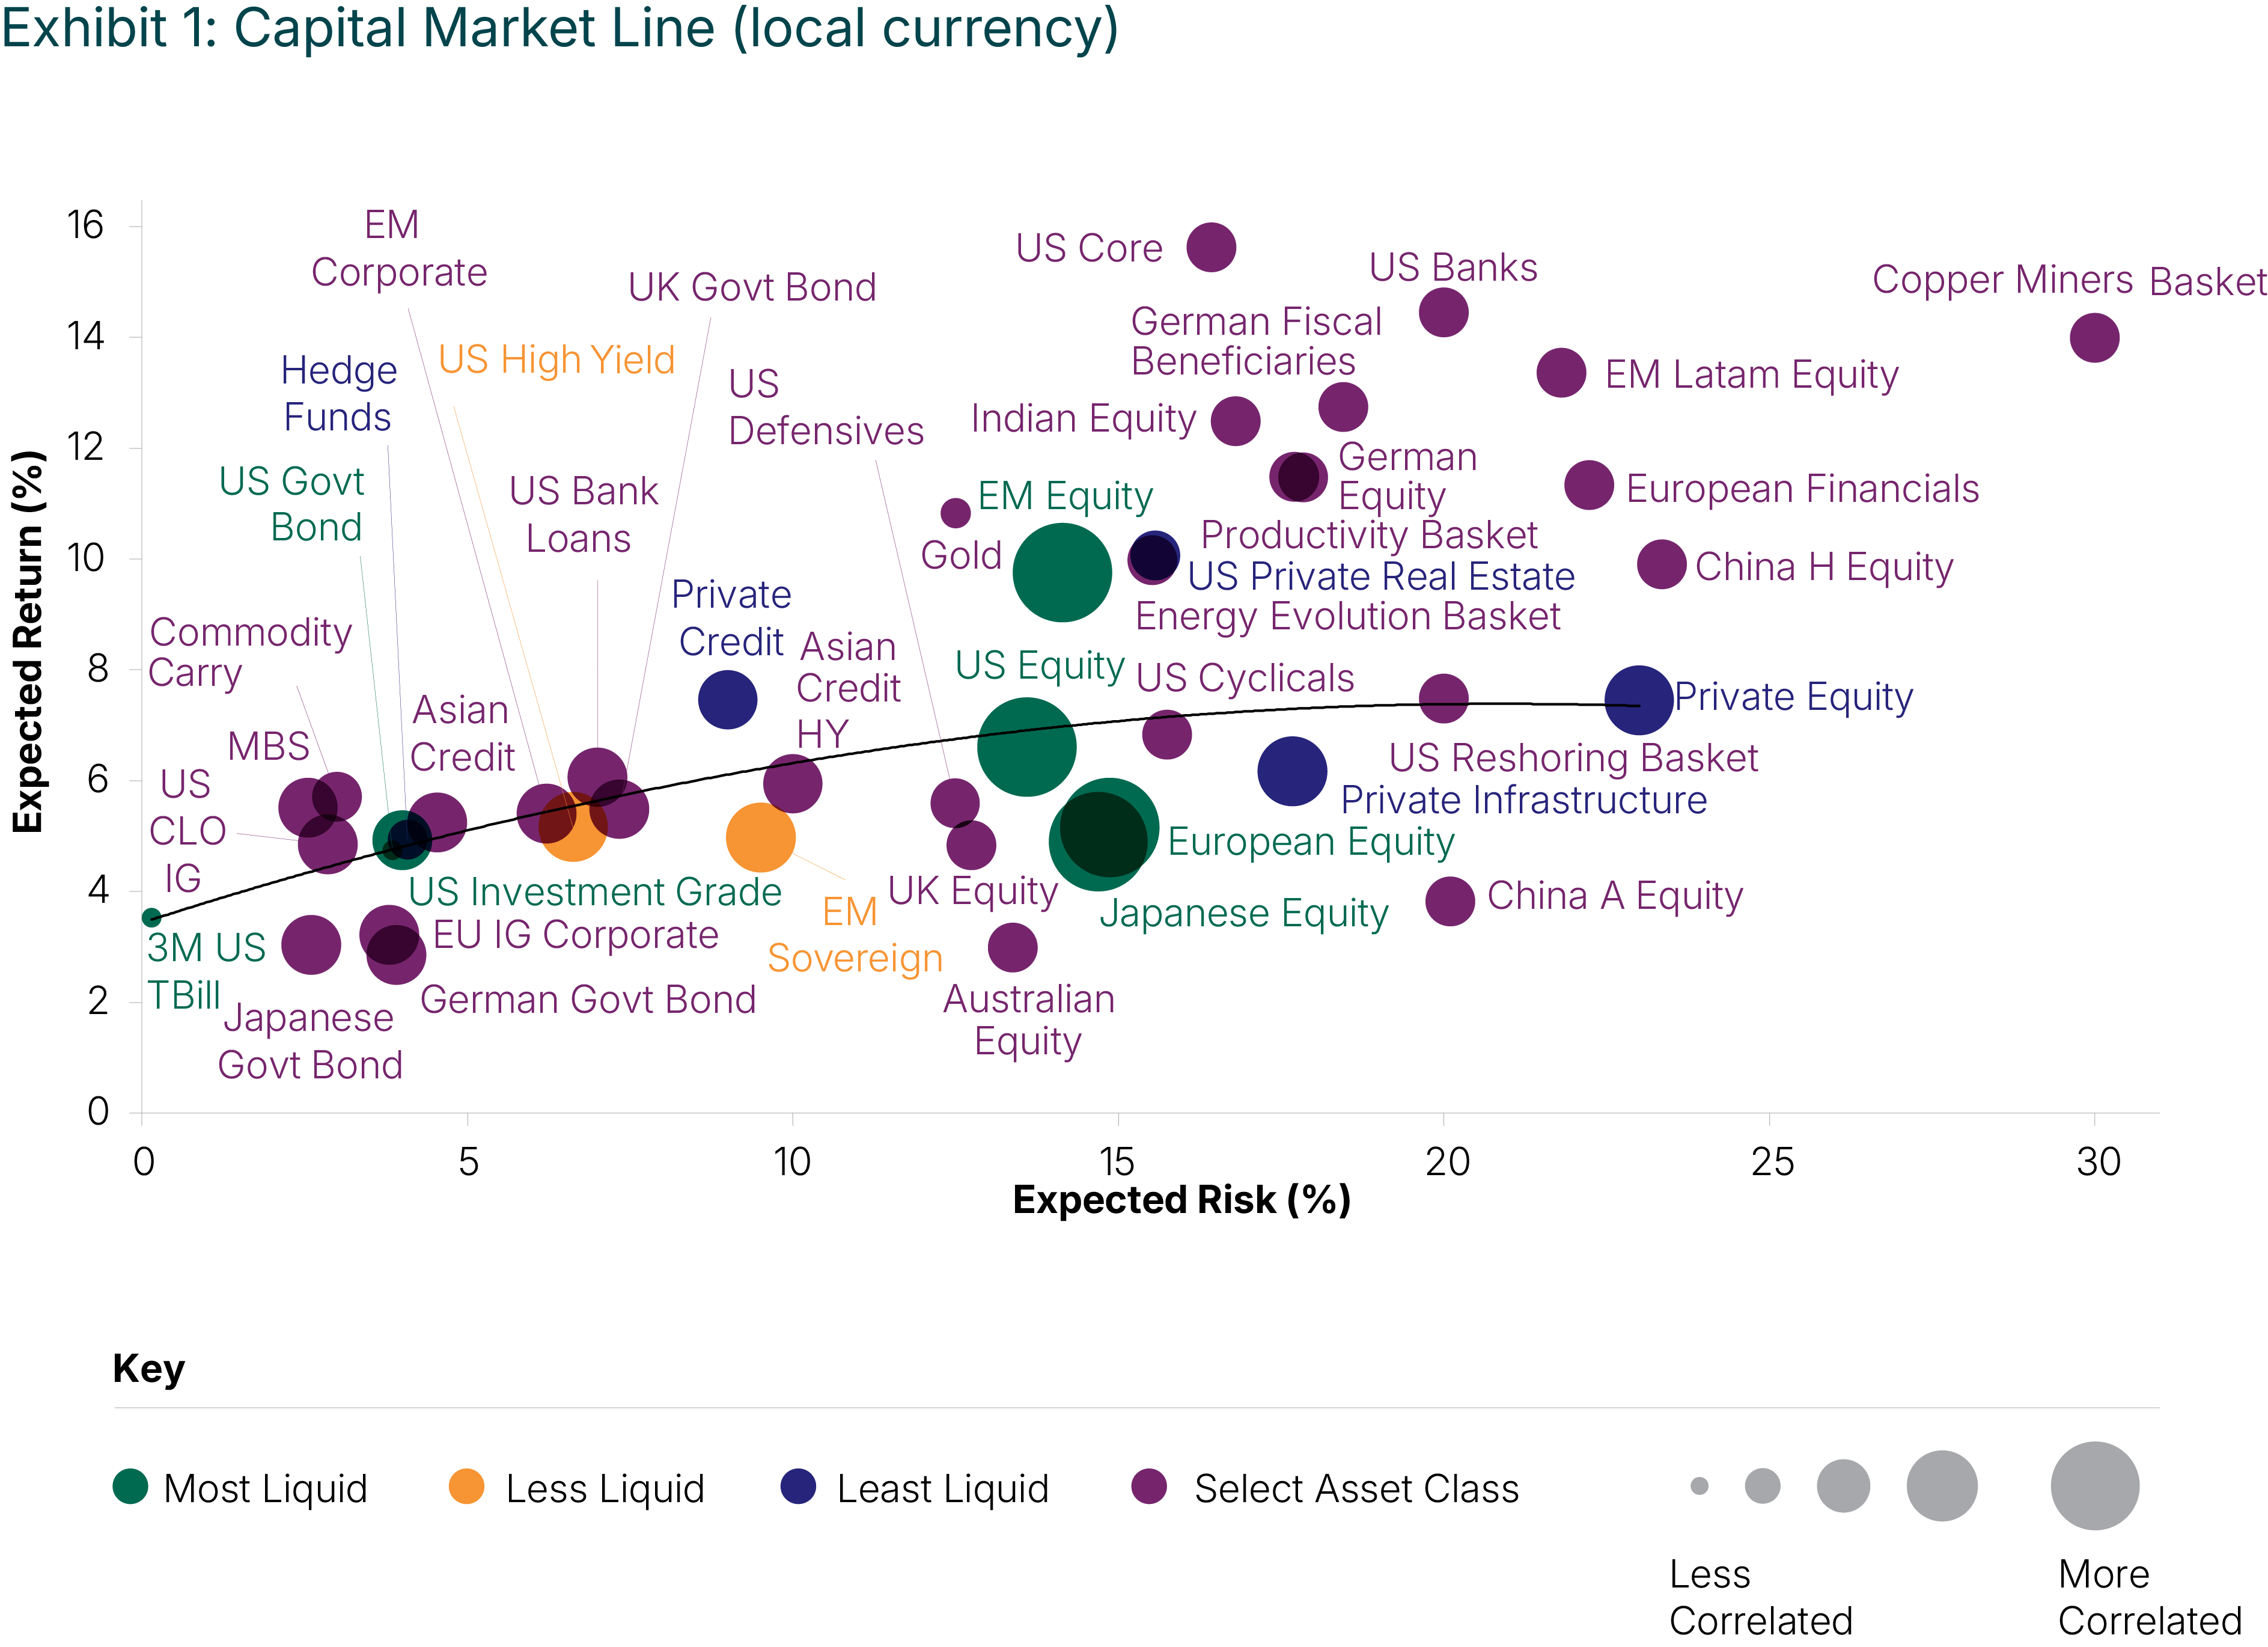
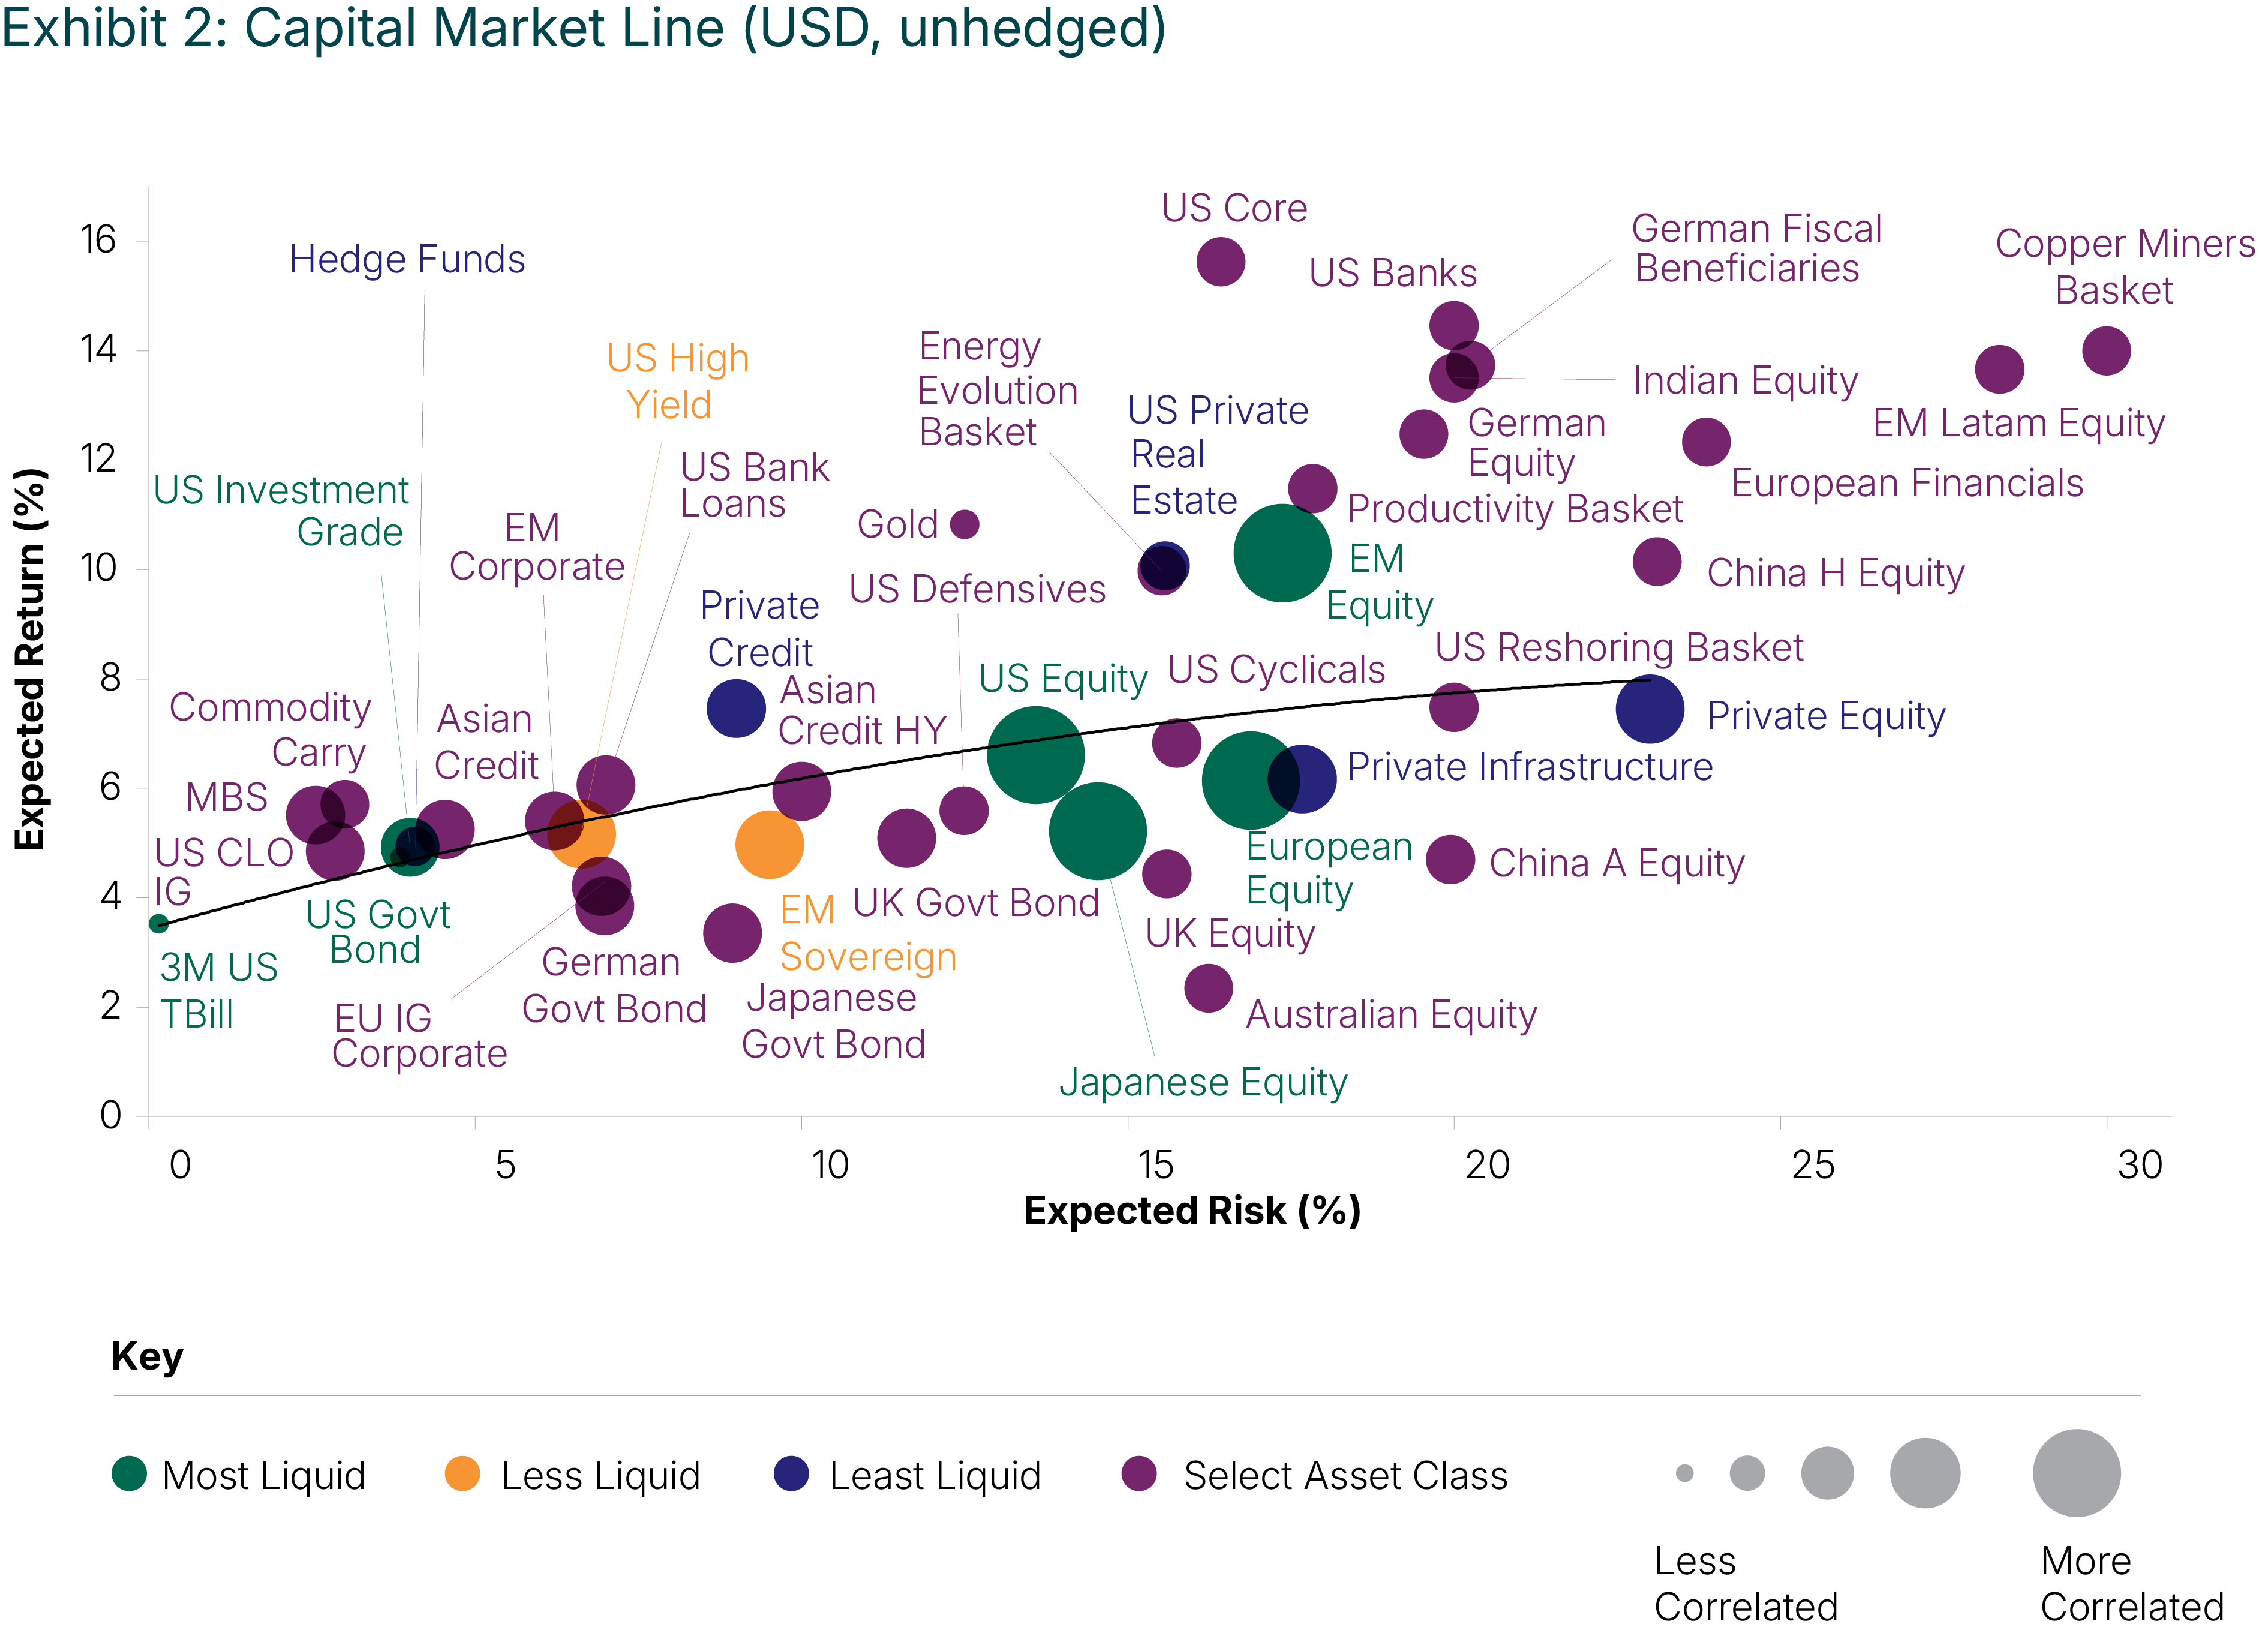
Please see Capital Market Line Endnotes. Note that the CML’s shape and positioning were determined based on the larger categories and do not reflect the subset categories of select asset classes, which are shown relative to other asset classes only.
Our forecasts presume tariff and energy price pressures will fade in the earlier part of our five-year horizon, while AI’s disinflationary forces build throughout. Growth has reaccelerated, led by a firm U.S. consumer and strong AI-related capital spending, reinforcing a soft-landing narrative rather than fears of a renewed hiking cycle. Underpinning the medium-term view is what may prove to be the largest investment wave in decades, spanning AI, supply-chain reshoring, the energy transition occurring amid a growing shortage of electricity and nuclear revival, and rising defense outlays. We would normally expect investment demand of this magnitude to drain the global savings glut, exerting a slow upward pull on real rates, particularly at the long end, while lifting productivity and, over time, spurring disinflation. This time, China’ massive and rapidly growing savings pile provides an offset. We see corporate profits benefitting from an AI-based productivity boom, supporting equity fair values and keeping credit spreads contained. The central debate for the next year is whether AI-led investment across memory, software, data centers and electricity proves inflationary enough to offset the disinflationary tailwinds settling in from tariffs, energy and China. We see this as a very short-term debate, as we believe that soon disinflation will affect all of these areas. Despite lingering risks from the Strait of Hormuz, we believe one should remain constructive on growth assets during this supply-led boom and buy interim pullbacks.
Equities: Focus on AI beneficiaries. Market leadership is showing early signs of broadening beyond the technology sector, with equal-weight indices recently outperforming their cap-weighted counterparts, though concentration remains elevated, particularly in emerging markets, where AI-linked semiconductors dominate index composition. We expect these sorts of rotations to be shorter-term in nature, with AI beneficiaries offering more durable returns over the medium term.
The AI story itself is entering a new phase: Attention is slowly shifting from the capital-intensive infrastructure buildout that markets despise to the shift from seat-based usage fees to token-based pricing. Crucially, lower token prices are not curbing demand, as usage is rising faster than costs fall. Meanwhile, enterprise routing between frontier and open-source models strengthens the hyperscalers that own the customer relationship, infrastructure and distribution. With AI in the initial stages of monetization, token usage surging, and investment spending soon to begin a slow deceleration, returns on invested capital should soon show early signs of stabilizing.
We see the most compelling opportunities in our productivity basket, which pairs today's AI infrastructure beneficiaries with the next phase of adoption, alongside the mega-cap technology leaders, financials and U.S. reshoring beneficiaries. Beyond the U.S., we find Japan and Europe slightly more attractive, with more appealing valuations, lighter positioning, and greater leverage to improving global growth.
Range-bound bond yields. The fixed income backdrop has become progressively less unattractive. The significant backup in yields over the past year has improved valuations, and with several near-term inflation pressures set to moderate, including tariff effects and energy, as well as favorable base effects, the balance of risks for duration is close to being back to normal. Recent labor-market data suggest limited urgency for the Fed to tighten further, but there is little room for error. If the inflation data even flickers higher, a credibility once-and-done hike may occur. Hiking without preparing the market would drive home a central point for Warsh that attempting to lower market risk by spoon-feeding policy guidance merely leads to greater leverage and risk-seeking behaviour.
We sense he would welcome an opportunity to reinforce his view that differences of opinion are healthy going forward and should drive markets. We don’t fear the prospect of a single credibility-driven hike, as it likely would help long-dated maturities. We are a bit more constructive on duration than at any point this year, finding the belly of the curve most attractive, with a growing case to extend further out. We remain mindful of the longer-term upward pressure on real rates from the capital requirements of AI infrastructure, the energy transition, and reshoring, with bond markets likely range-bound.
Go where the issuance is not. Tight spreads, an investment-grade-financed investment boom and accelerating M&A look poised to erode investment grade (IG) credit's edge over high yield (HY), with long-end, investment-oriented supply set to pressure IG more than HY, especially in the US. We expect modest spread-widening in 2026 as rising energy prices and the waning effect of tax rebates in the first half of the year slow growth somewhat. Of course, rising AI investment puts a floor under growth, with spreads focused on the resiliency it brings. We continue to favor Asian high yield (ex-China property), and we are now also interested in a handful of Latin American local-currency bonds, particularly where governments are moving in a more market-friendly direction and where the investment wave is pulling along USD-priced commodity exports.
Alternatives: Diversifying our diversifiers as gold's tailwinds fade. Our diversification approach has evolved materially. Stock-bond correlations have moved from strongly negative in the post-financial-crisis period to just above zero today. At times, such as during oil price spikes, they have been more positive, making the traditional stock/bond diversification less effective in general and potentially even less reliable during periods of volatility, when it is needed most. Gold, a core hedge when Fed credibility was being challenged, has seen several structural tailwinds fade: easing risk from conflict in the Middle East, higher real yields, and a Federal Reserve chair less inclined toward balance-sheet expansion, which since the advent of QE has created a steady and growing debasement bid. A sharp rally over the past few years left gold valuations elevated, with a higher correlation to broader risk assets that reduces its marginal diversification benefit. We see better diversifiers now elsewhere, including cash plus liquid alternatives and to a lesser degree, relative value commodity strategies.
Transitioning toward a more balanced mix of public and private sector growth. After the global financial crisis, Western economies experienced long but mild balance-sheet recessions, with weak consumption and investment as the private sector deleveraged counteracted by unconventional monetary policy and largely passive fiscal support that left central banks to do most of the work. That "old abnormal" persisted until around 2015, after which healthier household and corporate balance sheets supported higher growth. The post-pandemic surge in fiscal support was, in our view, a temporary and fragile form of U.S. exceptionalism. The Trump administration appears intent on rebalancing growth drivers, specifically by reducing government support and shifting momentum back to the private sector through tax incentives like dramatically accelerated depreciation. While that adjustment may create near-term sluggishness, in the context of an investment boom, we see it as a necessary step toward a more durable, investment-led growth backdrop.
China is easing to offset anti-involution policies. China's anti-involution campaign has not curbed fierce competition. Policymakers increasingly view a rising equity market as the preferred offset to overproduction, channeling liquidity toward stocks while curbing excess capacity in traditional and advanced manufacturing. That is easier said than done. Absent clear success on that front, policymakers appear intent on managing the downside from ongoing pay cuts at state-owned enterprises and letting real-estate overbuilding play out, provided it does not infiltrate the banking system. Both dynamics create a deflationary backdrop that narrows wealth gaps, a consequence the government has not resisted. In export-oriented "China Shock 2.0," leaders look to be using domestic deflation to manage the pace of yuan appreciation and thereby reinforce the country’s export prowess.
Europe is pulling the fiscal lever, though Germany's spending is coming through more slowly. Europe continues to turn to fiscal policy, led by Germany's defense and infrastructure buildup. In practice, that spending has come through slower than expected, held back by regulation and permitting bottlenecks. The impulse looks delayed rather than diminished, however, and we expect the country to make up the shortfall in future years as projects are approved. Beyond Germany, the picture is more constrained, with the EU having implemented only a fraction of the Draghi competitiveness recommendations. In our view, the region remains over-regulated for the competitive world it faces, and most member states aside from Germany lack the debt capacity to pull growth along.
AI: Improving economics meet emerging risks. AI remains a central force shaping markets, but the narrative is evolving from the buildout itself toward the economics of the AI stack, which are improving: Although token prices have fallen, total AI expenditures keep rising on strong demand elasticity and a surge in token-hungry agentic applications, pushing revenues ahead of the depreciation costs tied to hyperscaler investment. Meanwhile, the shift from seat-based to consumption-based pricing, more efficient hardware and routing across frontier and open-source models all support margins. Yet, the risks are becoming more visible. Questions around value distribution across the stack remain unresolved, as open-source models seem likely to erode pricing power at the model layer as infrastructure providers capture a greater share of the value. Cost dynamics are a further constraint, with memory becoming a larger component of hyperscaler spending, tight supply pressuring free cash flow and the largest beneficiaries by market capitalization also the most exposed to rising capital intensity. Political and regulatory risks are rising, too, in response to a growing perception that AI is advancing too quickly and that its benefits may not be widely shared. This calls for a dynamic, active approach that captures the upside while staying mindful of the shifting risks.
About the Capital Market Line
The Capital Market Line (CML) is a tool developed and maintained by the Global Multi-Asset Team. It has served as the team’s key decision support tool in the management of our multi-asset products. In recent years, it has also been introduced to provide a common language for discussion across asset classes as part of our Investment Strategy Insights meeting. It is not intended to represent the return prospects of any PineBridge products, only the attractiveness of asset class indexes compared across the capital markets.
The CML quantifies several key fundamental judgments made by the Global Multi-Asset Team after dialogue with the specialists across the asset classes. We believe that top-down judgments regarding the fundamentals will be the largest determinants of returns over time driving the CML construction. While top-down judgments are the responsibility of the Multi-Asset Team, these judgments are influenced by the interactions and debates with our bottom-up asset class specialists, thus benefiting from PineBridge’s multi-asset class, multi-geographic platform. The models themselves are intentionally simple to focus attention and facilitate a transparent and inclusive debate on the key drivers for each asset class. These discussions result in 19 interviews focused on determining five year forecasts for over 100 fundamental metrics. When modelled and combined with current pricing, this results in our annualized expected return forecast for each asset class over the next five years. The expected return for each asset class, together with our view of forward-looking risk for each asset class as defined by volatility, forms our CML.
The slope of the CML indicates the risk/return profile of the capital markets based on how the five-year view is currently priced. In most instances, the CML slopes upward and to the right, indicating a positive expected relationship between return and risk. However, our CML has, at times, become inverted (as it did in 2007), sloping downward from the upper left to the lower right, indicating risk-seeking capital markets that were not adequately compensating investors for risk. We believe that the asset classes that lie near the line are close to fair value. Asset classes well above the line are deemed attractive (over an intermediate-term perspective) and those well below the line are deemed unattractive.
We have been utilizing this approach for over a decade and have learned that, if our judgments are reasonably accurate, asset classes will converge most of the way toward fair value in much sooner than five years. Usually, most of this convergence happens over one to three years. This matches up well with our preferred intermediate-term perspective in making multi-asset decisions.