Private credit generally refers to corporate loans made by dedicated credit managers working outside the traditional bank-led broadly syndicated loan (BSL) market. Private credit borrowers tend to be middle market companies with annual revenues ranging from about $100 million to $3 billion – a segment banks and other traditional lenders tend to avoid, especially on the lower end.
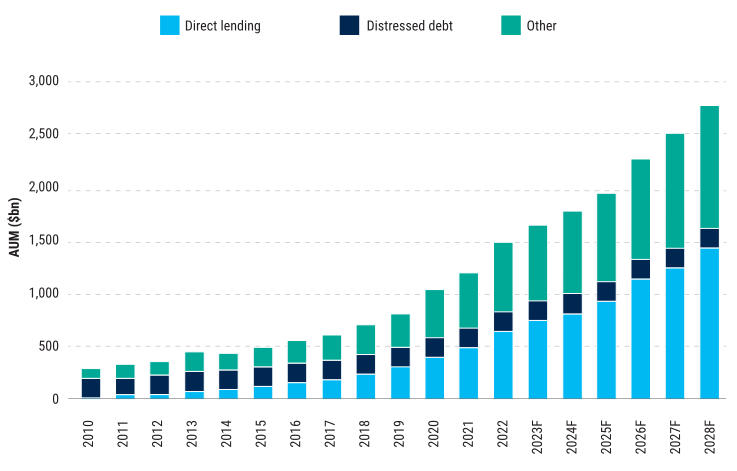
Private credit lenders work directly with borrowers to establish loan terms and pricing, and because they hold the loans on their own books, they have much greater flexibility regarding the types of loans they can underwrite. As such, private credit investment strategies vary widely and include direct lending – the largest contributor to the market, representing about 46% of all US private debt assets under management1 – along with collateralized loan obligations (CLOs), distressed credit, special situations, mezzanine debt, sector-specific debt, specialty finance, and net asset value (NAV) loans. The rising popularity of direct lending among borrowers, lenders, and institutional investors has pushed the size of this market to $1.4 trillion – just shy of the figure for the broadly syndicated loan market.2
Direct Lending Remains the Key Driver of Overall Private Credit Growth
Source: 2024 Preqin Global Private Debt Report.
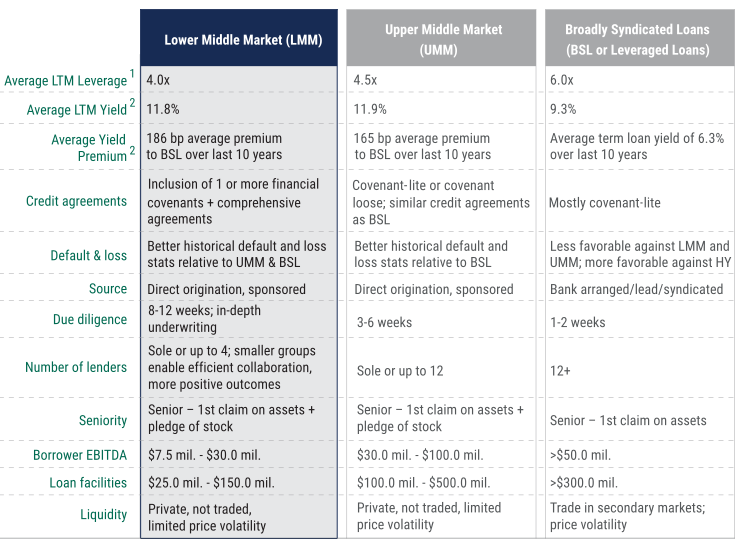
Direct lending can be broken down into three distinct segments – the lower, core, and upper middle market – each of which has distinct characteristics concerning competition, risk, and yield. We define the lower middle market (LMM) segment as companies with EBITDA of $7.5 million-$30 million, core as companies with EBITDA of $30 million-$50 million, and upper middle market (UMM) as those with $50 million-$100 million in EBITDA. The lower middle market’s smaller deals tend to have fewer participants (one to four), lower leverage, and strong credit agreement terms, with financial covenants to address potential risks.
We see several distinct advantages to investing in the lower middle market, either as a standalone allocation or to complement an existing larger market allocation. The lower middle market segment stands out for its demonstrated resilience throughout various macro environments (including periods of stress), and it has experienced less volatility in valuations, lower losses and defaults, and historically higher risk-adjusted returns relative to the upper middle market and other areas of public credit (please refer to the following charts).
We believe lower middle market direct lending is particularly compelling today, given the historical durability of the asset class amid a somewhat uncertain macroeconomic environment and high current interest rates (with moderate projected declines in the near term) – with average yields currently ranging from 11%-12%. Moreover, compared with UMM direct lending, the lower middle market offers a historically less competitive environment for lenders, stronger lender protections, lower attachment points, and wider spreads observed over time.
Direct Lending Features by Market Segment
Source: Provided for illustrative purposes only.
1 Source: LSEG LPC’s 2Q24 US Sponsored Middle Market Private Deal Analysis. July 2024. LMM as represented by “Direct Lending Middle Market - $0-$20mm of EBITDA.” UMM as represented by “Direct Lending Middle Market, >=$40mm of EBITDA.” BSL as represented by “Syndicated Large Corporate.” Last-12-month period from second quarter 2023 through first quarter 2024.
2 Source: LSEG LPC’s 2Q24 US Sponsored Middle Market Private Deal Analysis. July 2024. LMM yields as represented by “Direct Lending Traditional Middle Market Term Loan ($0 - $100M), 3-year term.” UMM yields as represented by “Direct Lending Large Middle Market Term Loan ($100-$500M), 3 year-term.” BSL yields as represented by “Large Corporate (Syndicated) Term Loan, 3-year term.”
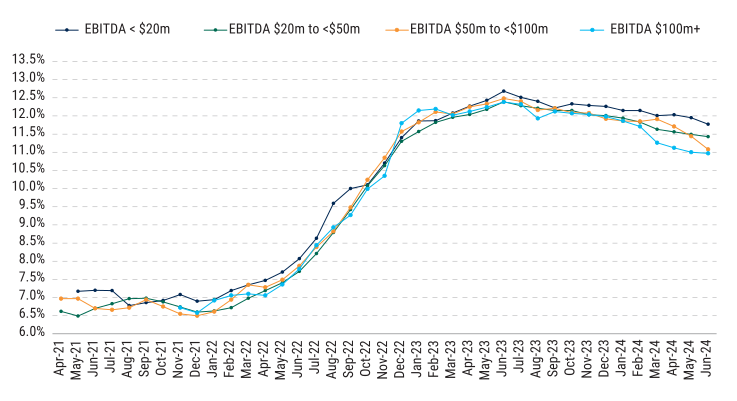
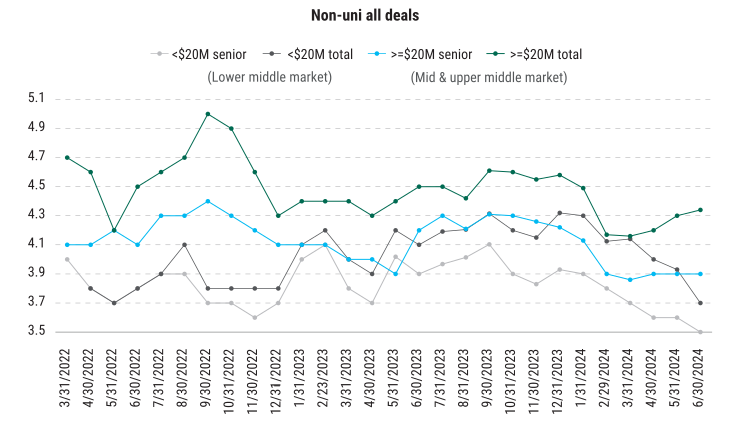
Lower middle market direct lending has historically offered a conservative leverage profile as well as better pricing. The second quarter of 2024 was no exception. The charts below show yields and leverage for middle market issuers by EBITDA.
Lower Middle Market Issuers Have Historically Higher Yields and Lower Leverage
Yields across EBITDA
 Leverage
Source: KBRA DLD Monthly Insights & Outlook. US Sponsored Deals – June 2024 Report. Publish Date: 17 July 2024.
Looking back over the past decade, LMM deals have averaged 4.0x leverage since 2013, compared with 4.6x for the upper middle market. And though the loans are smaller, lenders in the lower middle market tend to do more in-depth and lengthier due diligence, averaging eight to 12 weeks (versus three to six weeks for UMM lenders).
The typically smaller size of lower middle market deals can also offer investors the potential for attractive risk-adjusted returns, thanks to these deals’ enhanced safety features, supported by more protective credit agreements (i.e., stronger covenant packages) and more conservative and simplified debt/equity structures.
A Proskauer Rose survey from last year supports this emphasis on protective covenants, showing that along with EBITDA add-backs, the other top risk in direct lending is covenant-lite transactions or springing covenants. The survey also showed that the higher the EBITDA level, the more likely lenders are to consider a covenant-lite deal, with nearly half willing to consider deals with no covenants at all. In comparison, just 2% of lenders to the under-$30 million EBITDA market would consider a covenant-lite deal.
Smaller Deals Issued in 2023 Offered Better Protections for Lenders
Borrower size and covenants
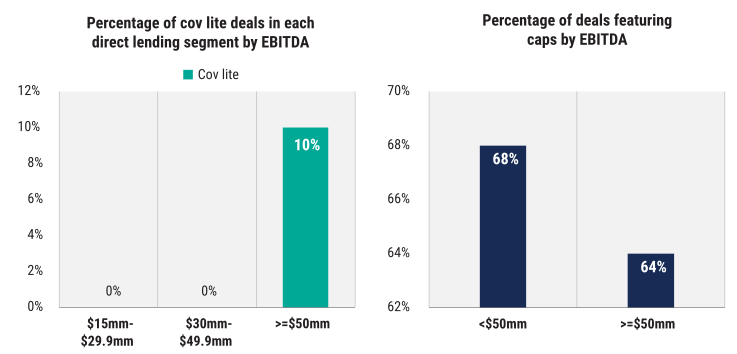
Source: Provided for illustrative purposes only. Source: Proskauer Private Credit Insights 2023. Data set relates to 363 deals across 138 private equity sponsors.
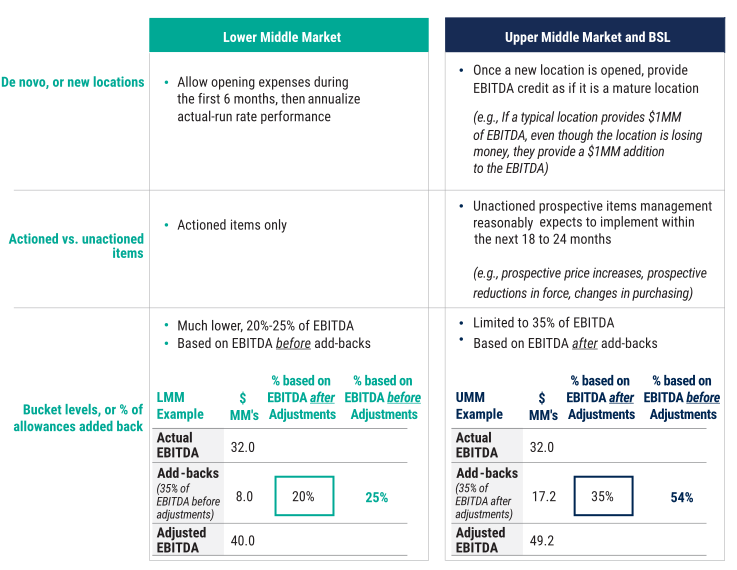
Lower middle market lenders are also much more conservative about EBITDA add-backs and adjustments. Consider the difference in approach to actioned versus unactioned items between lower middle market and upper middle market lenders (see table below). The former will consider EBITDA adjustments only to already-actioned items, whereas the latter will consider adjustments on items that remain unactioned, perhaps for the next 18 to 24 months, such as prospective but not-yet-implemented price increases.
LMM Deals Take a Stricter Approach to Add-Backs and Adjustments
Examples of add-backs and adjustments
Source: For illustrative purposes only.
In our view, lower middle market lenders typically are less tolerant of pro forma EBITDA adjustments and add-backs and more conservative when quantifying the impact of synergies. Data collected by Proskauer Rose3 shows that as company size increases, caps on nonrecurring expenses to EBITDA are less prevalent and a larger proportion of run-rate synergies is more acceptable. Wider allowances create the illusion that cash flow is sufficient, but if there are too many add-backs, the company may not be generating enough cash to service debt.
The lower leverage that’s typical in lower middle market direct lending has another advantage worth considering: It makes loans less sensitive to higher interest rates. That has proven to be a key part of lower middle market lending’s appeal in today’s higher rate environment, albeit with moderate projected declines in the near term.
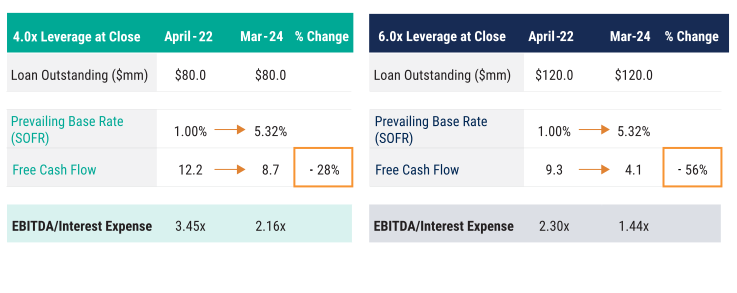
The example below shows how two deals – one with a smaller loan amount and 4x leverage at close and one with a larger loan and 6x leverage at close – might fare as the base interest rate (SOFR) climbs from 1% to 5.32%. The hit to free cash flow for the larger deal is much more severe (-56% versus -28%). Notably, the lower middle market loan example that starts with 4x leverage also maintains sufficient interest coverage of 2.16x, significantly above the level we would consider concerning, despite the sharp rise in interest rates since inception.
Starting Leverage Has a Big Impact on Interest Rate Sensitivity
The impact of higher closing leverage with rising interest rates
Interest coverage in an increasing interest rate environment*
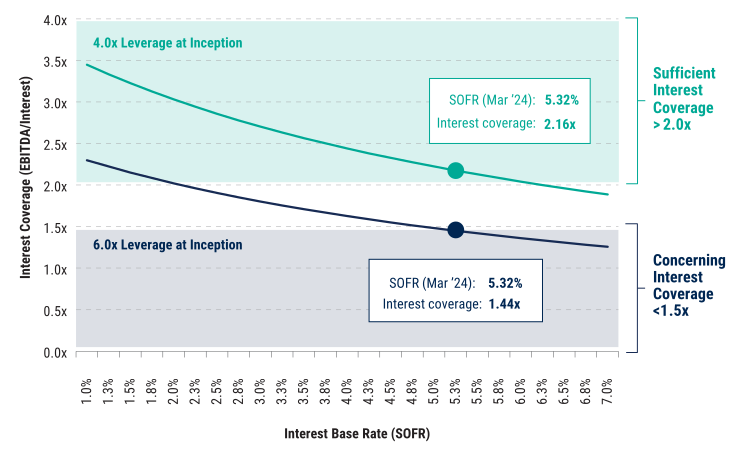
Source: Illustrative example for a $20 million EBITDA borrower with two at close leverage scenarios – one at 4.0x (for $80.0 million loan outstanding balance at close) and one at 6.0x (for $120.0 million loan outstanding balance at close). Prepared by PineBridge Investments in June 2024. A $20.0 million EBITDA borrower has been selected as that is the average size across PineBridge Private Credit’s total portfolio of 82 loans since inception and through 30 June 2024. *EBITDA/Interest Expense, Assumes Spread of 6.25%.
The rapid rise of the direct lending market segment has raised some concerns, including the transparency and accuracy of private loan valuations – where some managers may take too long to accurately reflect the financial health of a company by way of its valuation to investors. Another trend we find worrisome that is raising concerns among investors and regulators alike is the rising number of payment-in-kind (PIK) deals that involve the deferment of interest payments, with the lender sometimes agreeing to take noncash alternatives as payment, such as other securities or equity. PIK deals can indeed obscure the financial health of a borrower. This particular trend is further impacted by the relatively new phenomenon of “synthetic PIK,” whereby delayed draw capacity is being utilized for financial engineering rather than growth – using proceeds to pay lenders interest and further adding leverage. Investors have also raised concerns about non-accrual and default rates in the current high-interest-rate environment. These issues bear watching and underscore the importance of strong and thorough due diligence across all market segments.
Among the many other potential benefits of lower middle market direct lending, we believe several factors may help insulate its performance from the vagaries of the economic cycle. These include:
- An average structured maturity of five years (though a typical hold period of 3.5 years), during which there is no trading and limited mark-to-market volatility
- Historically attractive yields, protected by SOFR floors
- Senior secured first-lien status
- Traditional covenant protections
- Fewer lenders in a lower-middle-market loan facility, which allows for more streamlined collaboration and direct communication with management and sponsors, leading to enhanced oversight and potentially better investment outcomes
Lower middle market direct lending should remain compelling for investors given its attractive risk-adjusted return profile, steady performance, and low volatility, along with stronger covenants relative to the upper middle market. We see ample opportunities in LMM direct lending today and believe investors drawn to the potential advantages can benefit from working with a manager with deep experience and strong relationships to increase allocations to the asset class.
In our experience, lower middle market companies with long operating histories, leadership positions in their market segments, and seasoned management teams have demonstrated durability through both strong and weaker environments. The strongest borrowers are those that benefit from real cash generation and a competitive “moat”: businesses that provide distinct relevance and value to their clients. When paired with a conservative approach to portfolio construction and underwriting, investors who target these types of opportunities have historically stood to garner durable risk-adjusted return potential across macroeconomic environments.
Opinions expressed herein are solely those of the Private Credit (Alternatives) team and may differ from the views or opinions expressed by other areas of MetLife Investment Management. This material is for informational purposes only and does not constitute: (i) research or a product of any research department, (ii) an offer to sell, a solicitation of an offer to buy, or a recommendation for any investment product or strategy, or (iii) any investment, legal or tax advice. Any opinions, projects, forecasts and forward-looking statements contained herein are speculative in nature, valid only as of the date hereof and subject to change. All investment strategies involve risks, there can be no assurance that the investment objectives of any particular strategy will be met in any particular circumstances. Past performance is not indicative of future results. All information has been obtained from sources believed to be reliable but its accuracy is not guaranteed and no independent verification of the information has been obtained. Transactions involving securities and financial instruments mentioned herein (including alternative investments) may not be suitable for all investors. See Disclosure Statement for more information.