Corn
We expect an abundant corn crop in 2026 to sustain high domestic supplies, while Brazil is projected to set a new record corn harvest driven by expanded acreage. Fair weather and good yields could result in yet another banner year of global production that will weigh on prices. We anticipate the robust demand for corn and derivative products and exceptional export activity of 20251 will continue into 2026. Futures markets currently indicate that corn prices will continue to increase through 2026 and into 20272. Profitability will ultimately come down to input prices, which have remained sticky since rising dramatically in 2022.
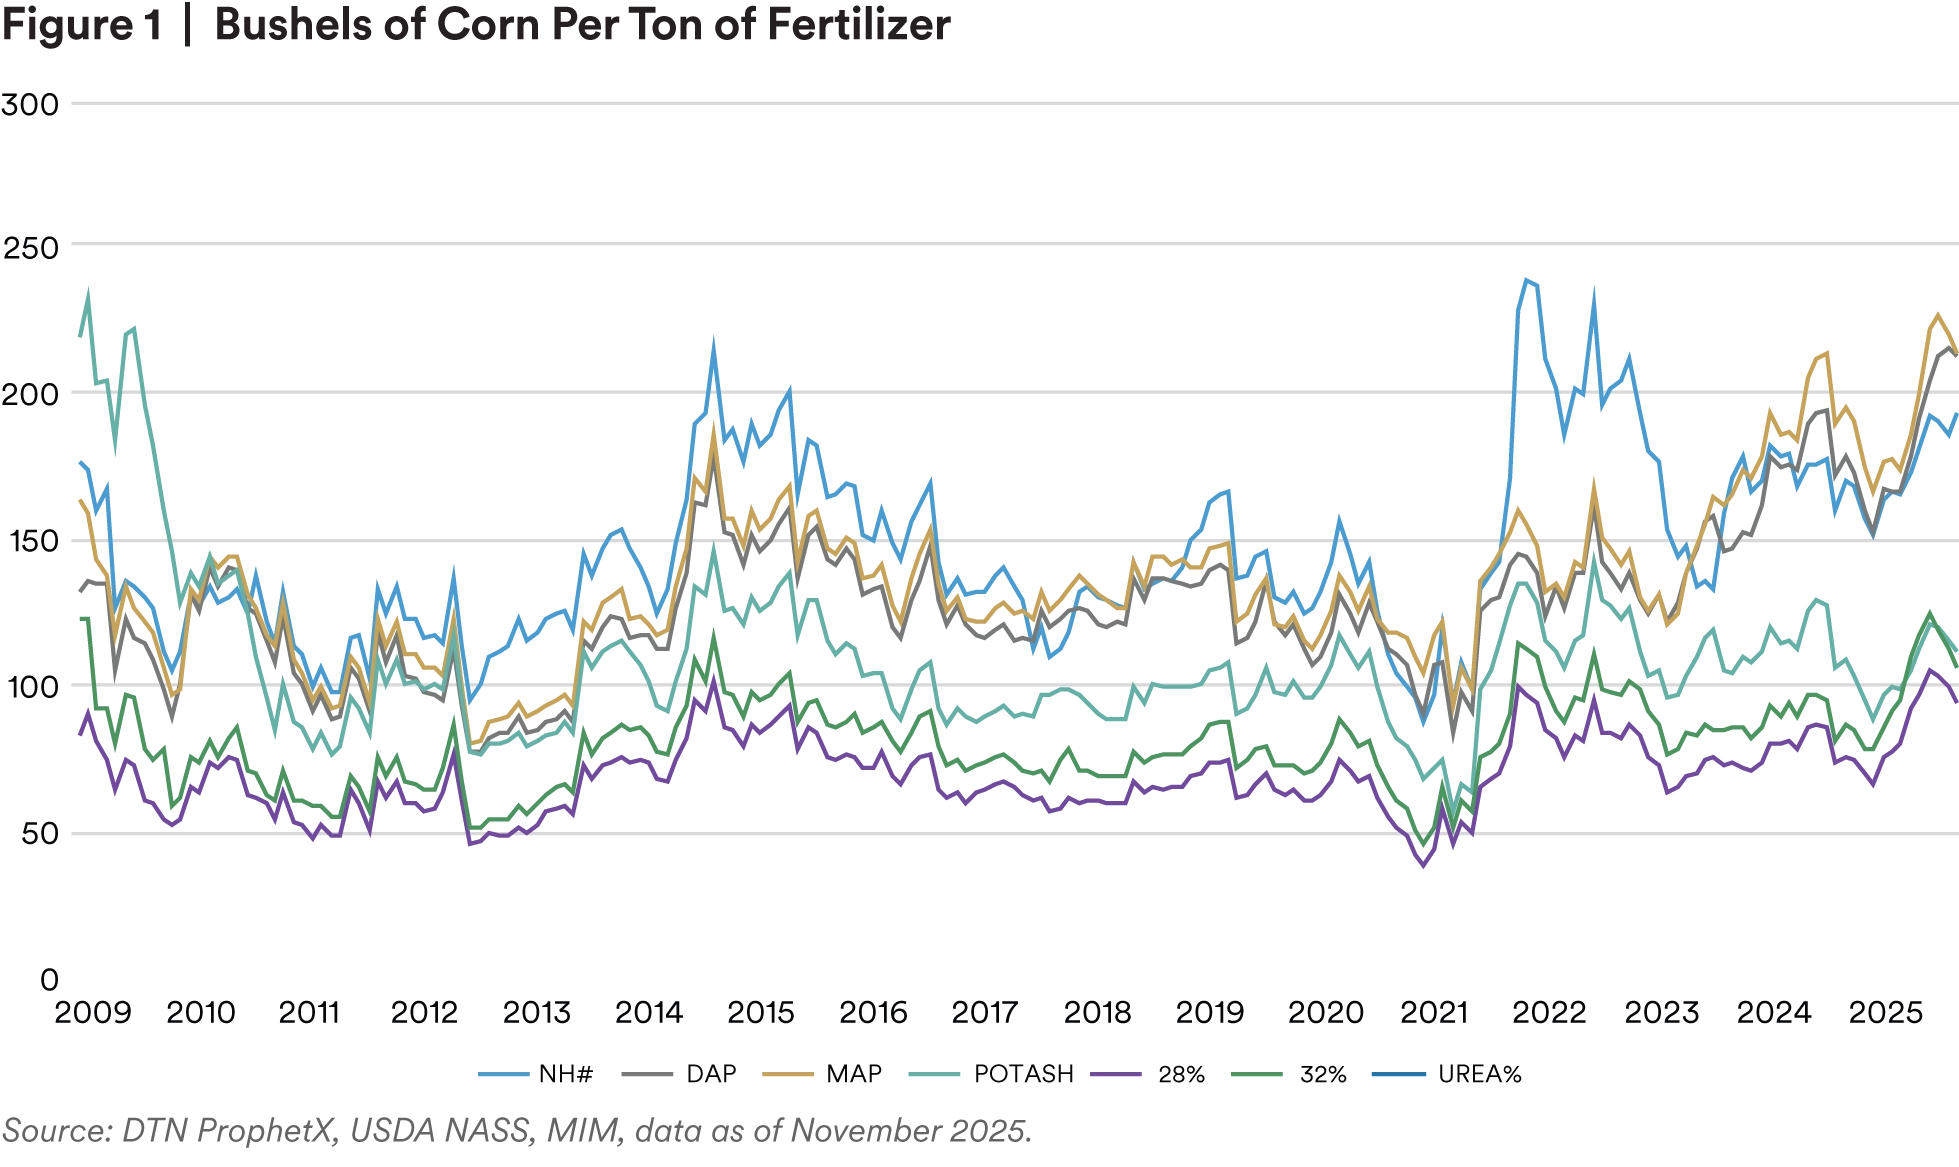
Looking ahead, we expect fertilizer prices to remain elevated and to be the primary driver of input cost inflation throughout 2026, continuing the recent upward trend3. Compared to corn prices, multiple fertilizers are more expensive now than they were during the peak of the pandemic-era supply chain disruptions (Figure 1). We expect 2026 to have windows of opportunity for profitability, but individual performance will depend on timing of marketing decisions and input purchases, and overall, we expect profitability on average to be slightly lower than in 2025.
In the longer term, several policies that are in the works could benefit the sector, the most significant of which would be increasing the national average ethanol blend rate. While Brazil has continuously increased their government-mandated blend rate, which now sits at 30%,4 the U.S. average blend rate has seen very modest growth over the last decade and only started continuously exceeding 10% in 20175. Increasing the average ethanol blend rate would be a significant win for the sector. But doing so would require policies such as allowing year-round sales of e15 or expanding the Renewable Fuel Standard (RFS), as well as time and investment to expand domestic ethanol production capacity. If achieved, it could provide a needed source of consumption as yields and productivity continue to increase. Increasing the average ethanol blend rate by 5% would require about 6.75 billion additional gallons of ethanol, which translates to roughly 2.4 billion more bushels of corn per year.
Soybeans
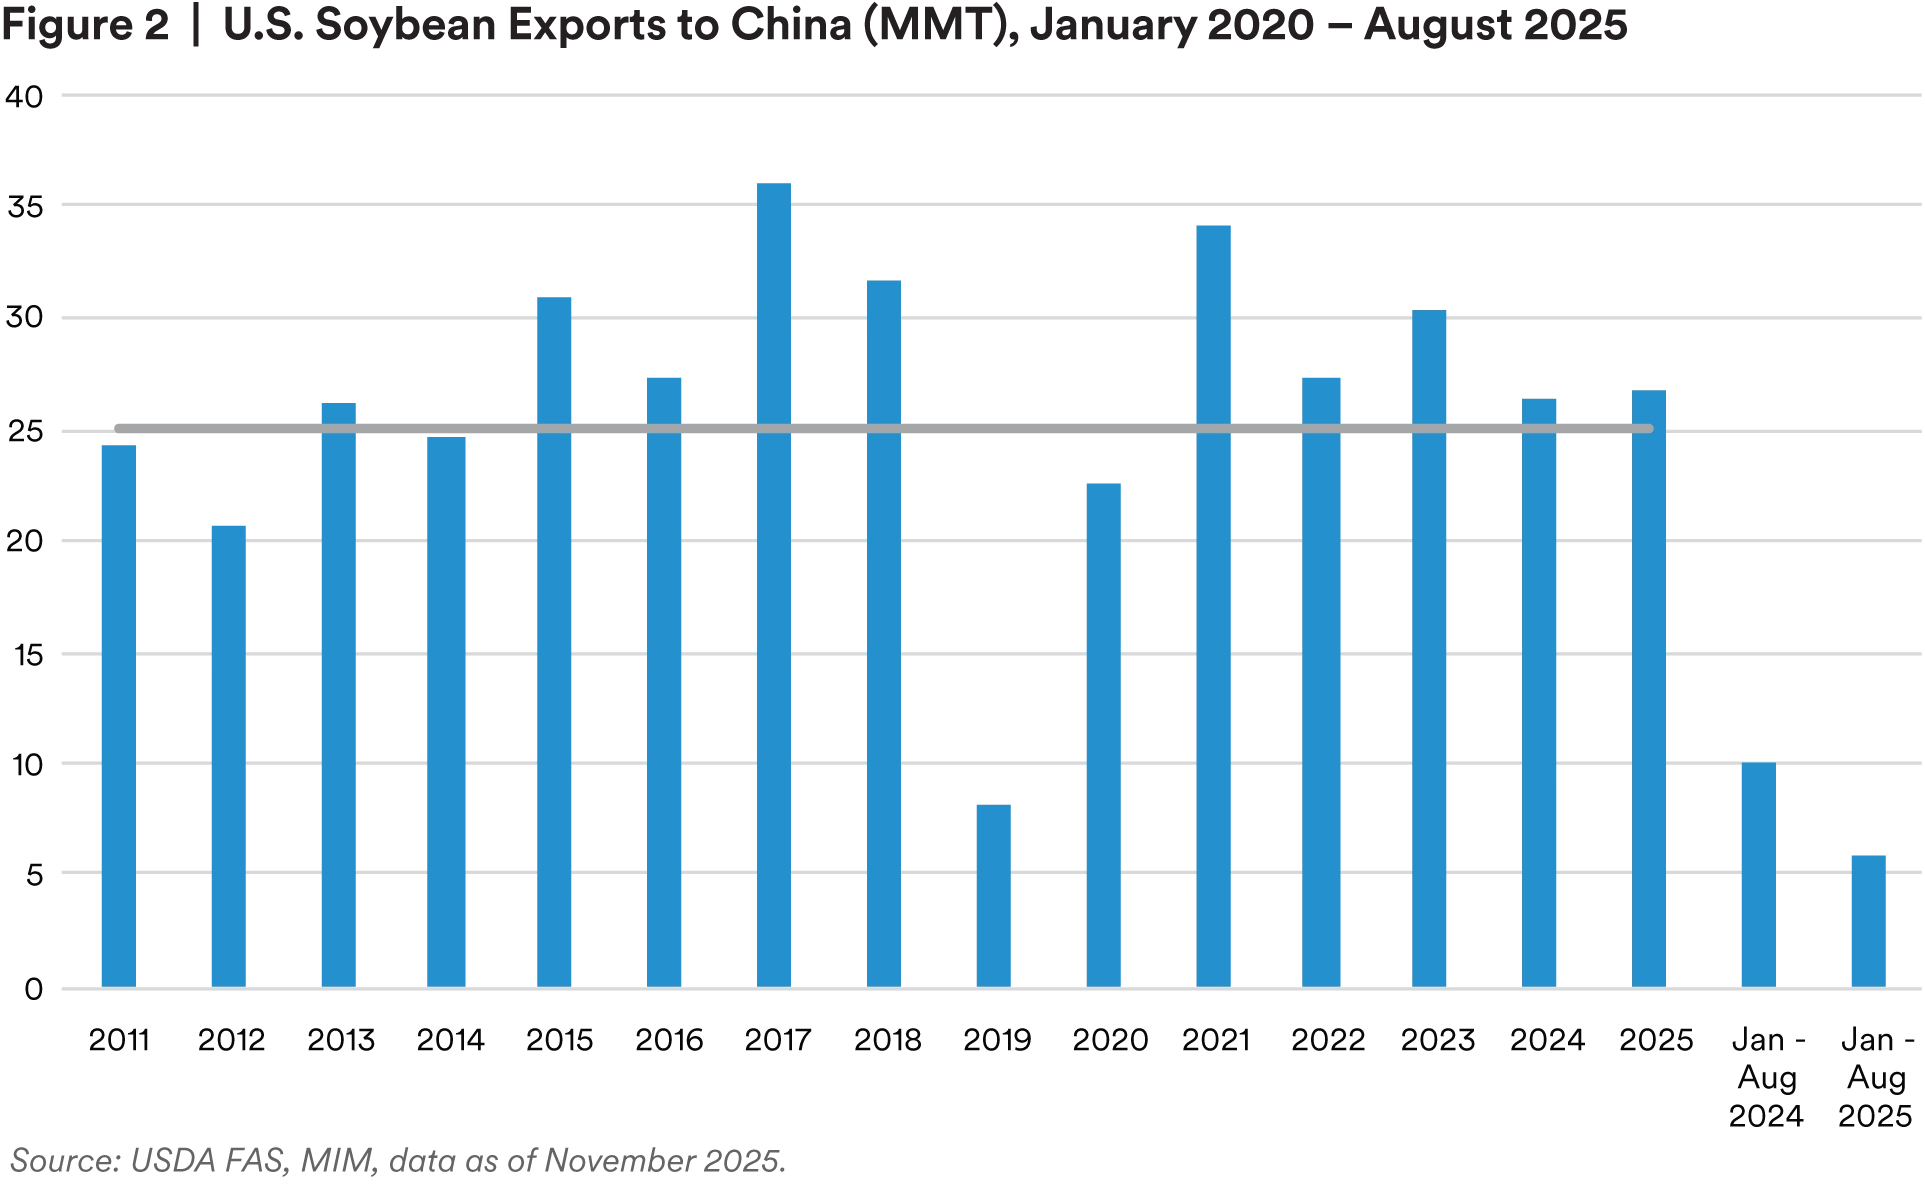
Heading into 2026, we expect soybean profitability to be modestly improved over 2025. The U.S.–China soybean purchase commitment of 25 million metric tons is projected to underpin price support in 2026, reducing uncertainty and helping maintain prices above the lows recorded over the previous year (Figure 2). Some potential upside to prices could come from the various efforts the U.S. has made to open foreign export markets to U.S. agricultural products. However, many of those deals lack concrete details about how they would impact demand for U.S. soybeans, and how those purchases would be enforced. Assuming the U.S.–China deal does not fall through, the uncertainty for soybeans appears to be on the upside.
In the long run, yields will continue to increase, and the industry will need to find new consumption and demand sources to keep up with production. The Environmental Protection Agency’s (EPA) upcoming RFS revisions are expected to raise biomass‑based diesel renewable identification numbers (RINs) allocations to 7.12 billion in 2026 and 7.50 billion in 2027, providing stronger demand for soybean‑derived biofuels6. Additionally, the EPA plans to reduce the value of RINs generated from imported renewable fuels and feedstocks, aiming to strengthen domestic markets. While these measures are significant, domestic crush capacity is limited. The U.S. Department of Agriculture (USDA) estimates the total U.S. soybean crush capacity at approximately 2.8 to 3.1 billion bushels7, approximately two-thirds of domestic soybean production. Expanding domestic consumption via crush and biofuel production could support domestic prices and reduce the reliance on exports, but achieving this will require time, investment and policy.
Wheat
We expect U.S. wheat prices to increase throughout 2026, but profitability will remain a challenge for most producers. While prices could rise even higher if poor weather results in lower average yields, multiple other factors in global markets could exert offsetting downward pressure on prices and profitability for U.S. producers. Global wheat output is expected to set a new record in 2026, extending an eight‑year streak of rising production (Figure 3). A ceasefire between Russia and Ukraine could see a rebound of wheat production in those countries, pushing global wheat production to another extreme. However, Russian wheat production hasn’t been as impacted by the war as Ukraine’s has, and a shift in the front could change that, curtailing production and reducing global supplies.

Cotton
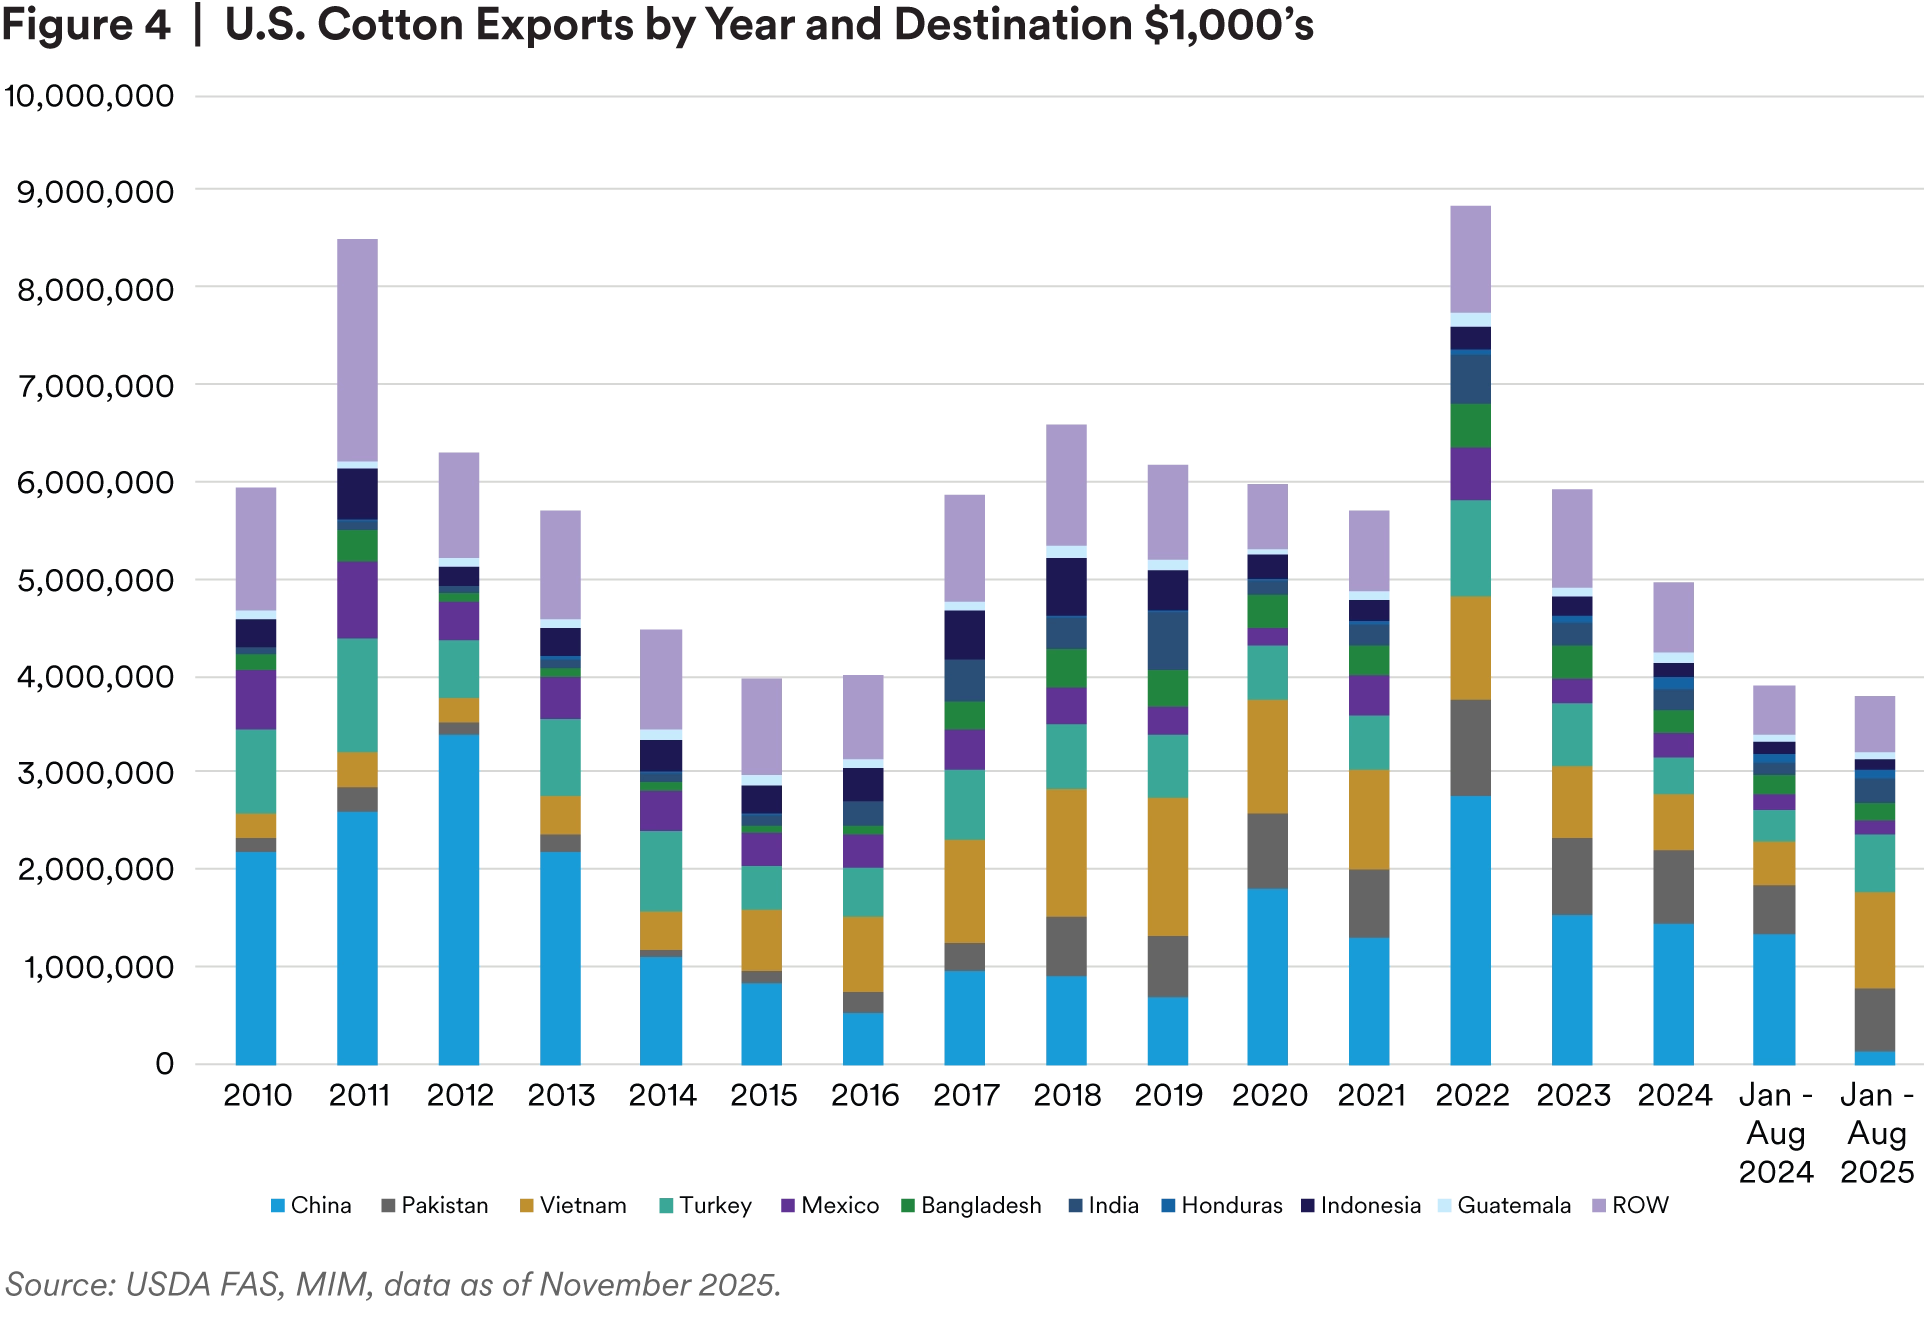
We expect the lackluster profitability outlook of 2024 and 2025 to persist through 2026. In 2026, the U.S. cotton industry will continue to depend heavily on overseas markets, accounting for roughly 85% of U.S. cotton shipments. Exports to China in 2025 were decimated compared to 2024, and exports to other destinations increased commensurately. While the USDA forecasts 2025/2026 to have the lowest global ending stocks in four years, U.S. stocks and stocks-to-use ratios have been increasing. If the elimination of Chinese tariffs on U.S. cotton causes exports to China to rebound, and the increased exports to other destinations are maintained, cotton prices could be supported and the outlook could improve.
Almonds
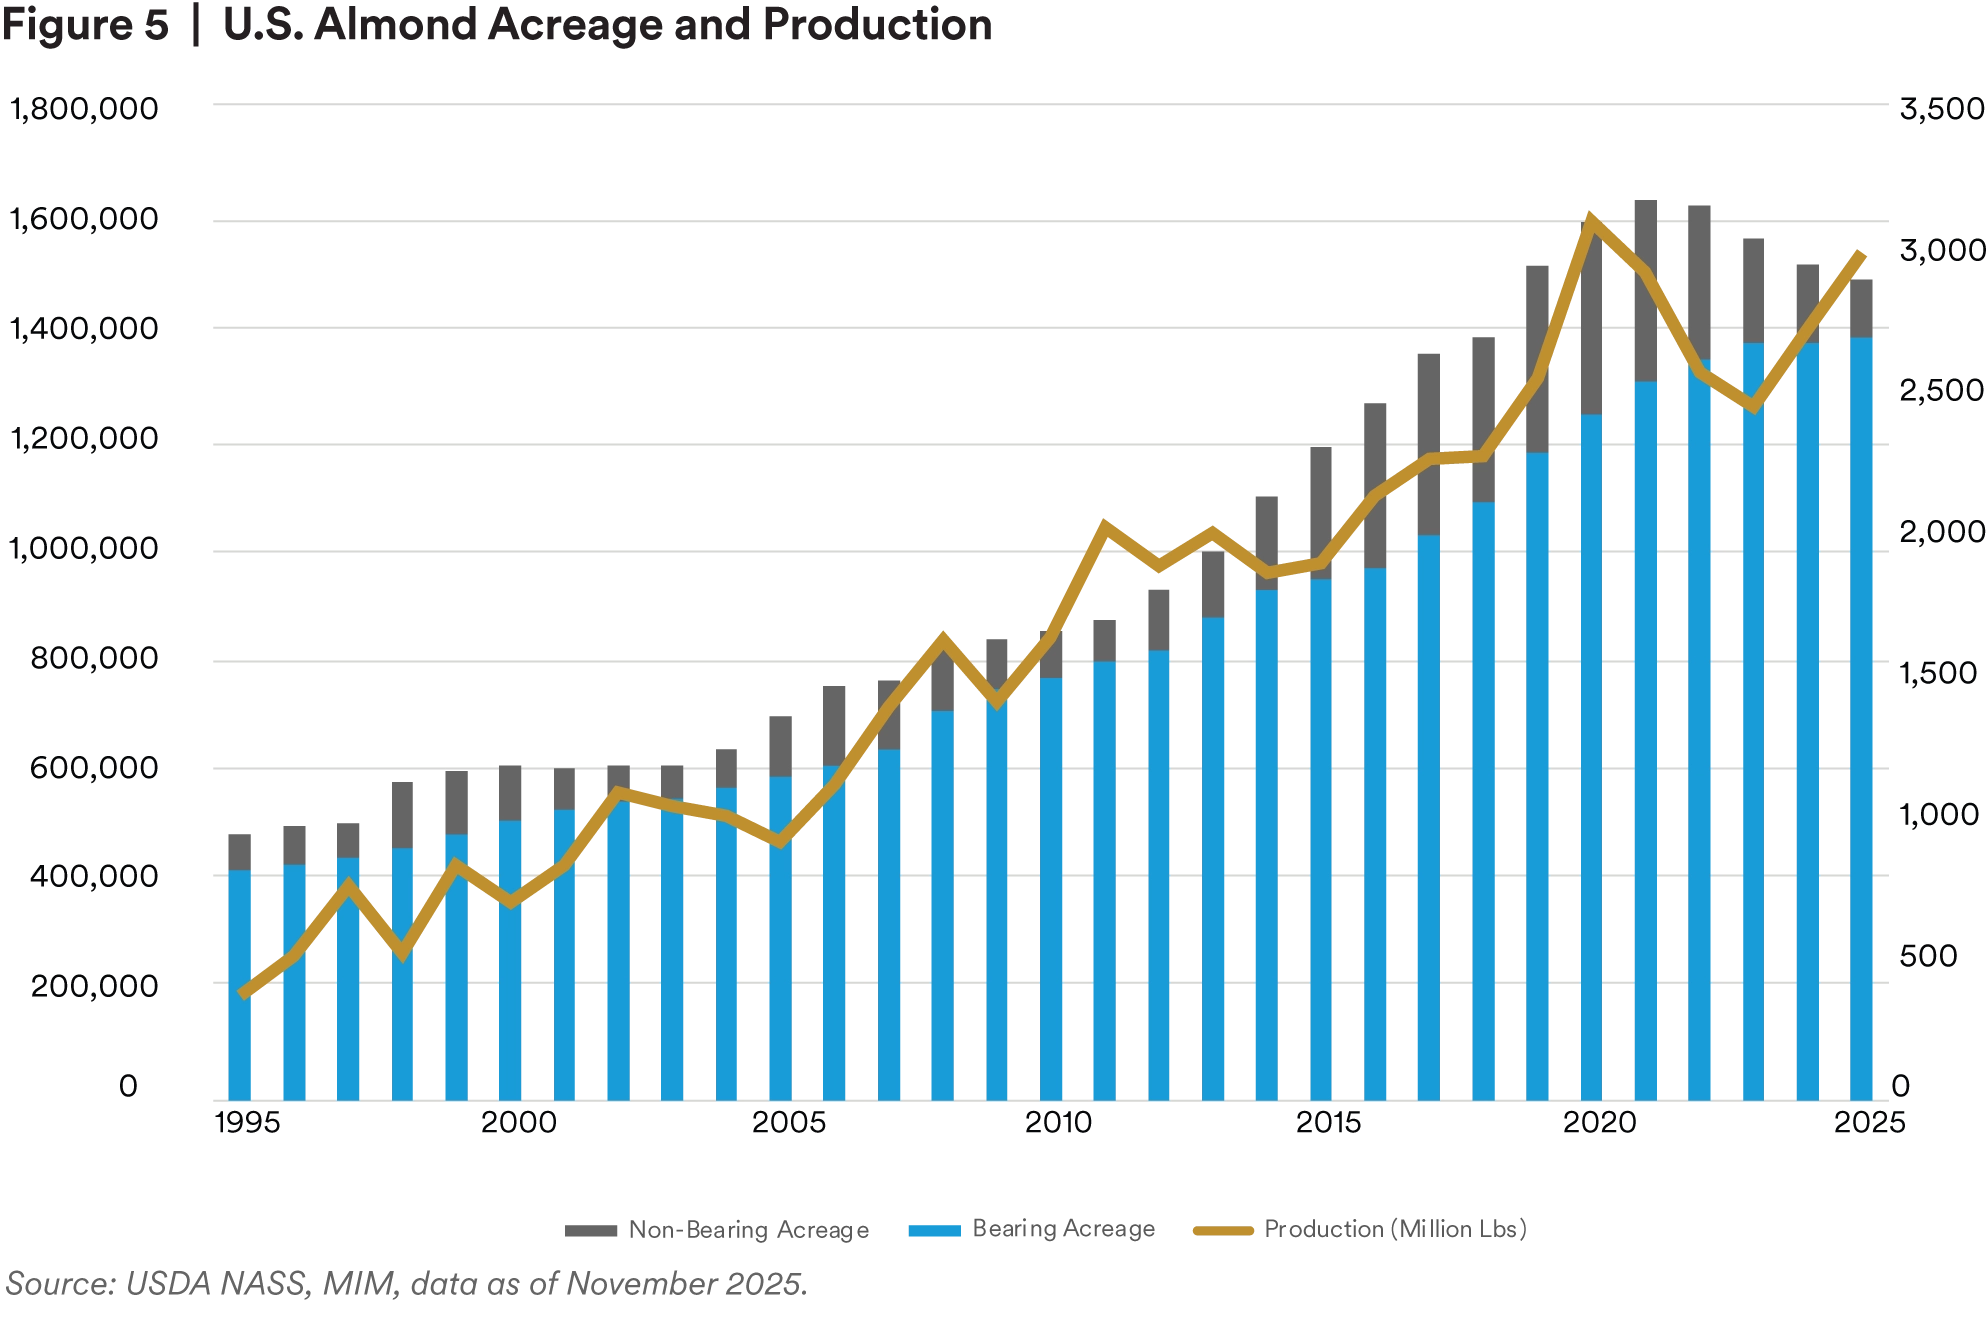
For 2026, we expect the almond industry to experience a welcome year of stability. The almond industry is well positioned to see sustained upward pressure on prices. Water accessibility will continue to constrain acreage expansion, helping sustain the current upward cycle in prices. We expect the almond industry to continue successfully marketing, finding new consumers and generating demand against a more-or-less fixed supply curve.
Trade and tariffs remain a notable risk, but to date, exports have not been materially affected by the ongoing trade dispute. The U.S. accounts for approximately 80% of global almond production, and this significant market share has helped insulate the industry. The limited availability of alternative sources makes it less likely that almond exports will face significant disruption as a result of these trade tensions. However, the industry’s high reliance on exports means that any disruption, should it occur, could have consequential negative impacts.
Pistachios
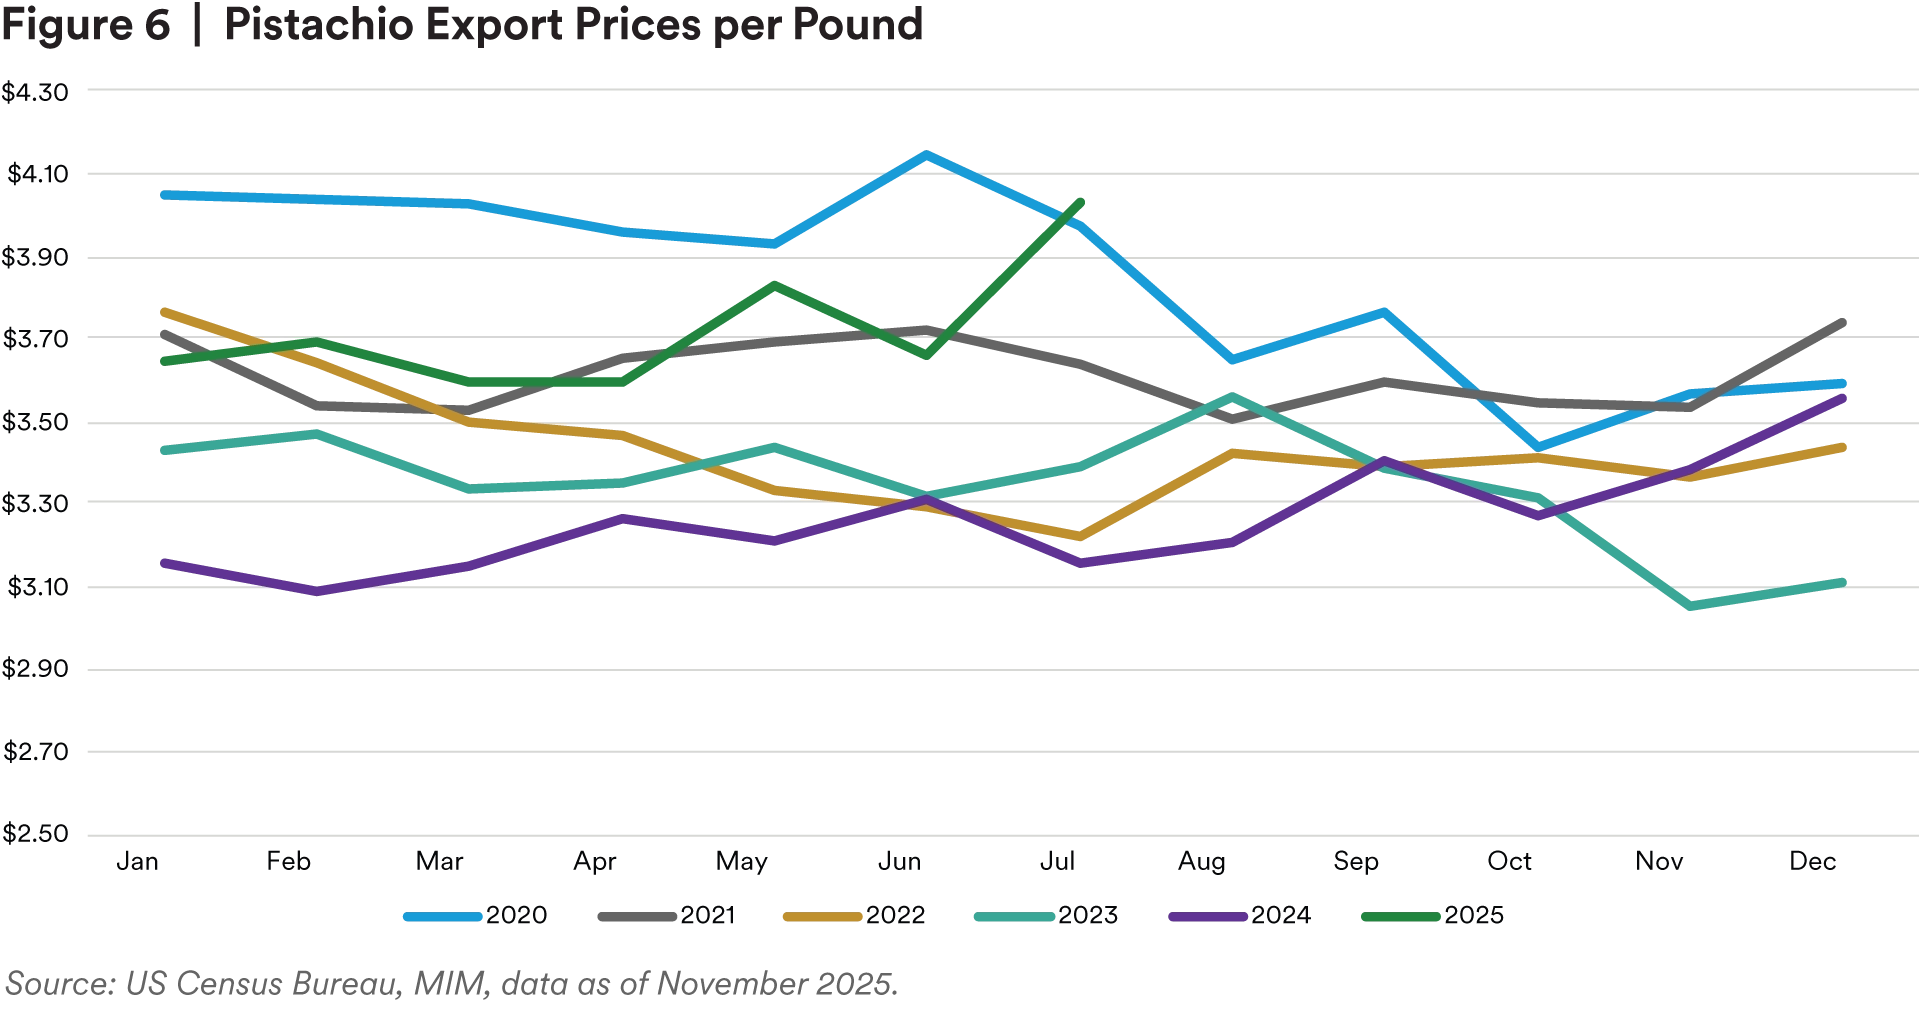
We expect 2026 to be a favorable year for pistachio producers. Pistachios continue to benefit from a similar rally in prices as almonds, with export prices in July 2025 reaching their highest level since June 2020 (Figure 6). Although new pistachio development has slowed drastically, a significant number of immature orchards will be reaching productive maturity in 2026 and the coming years, which will test global supply and demand fundamentals. Water scarcity, alongside elevated costs for fertilizer and fuel will continue to weigh on producers, but the robust demand and rising prices make the industry well positioned for profitability heading into 2026. Pistachios face similar downside risks as almonds due to their reliance and exposure to access to foreign export markets.
Apples
Juxtaposed against almonds and pistachios, which are coming out of a cycle of low prices, the 2026 apple market is expected to remain in a down‑cycle, as rising production is projected to keep farm‑gate prices subdued. The industry as a whole cannot yield its way out of low prices. Profitability of individual producers will depend on fruit mix and yields, with Honeycrisp potentially fairing the best, if 2025 were to repeat itself, as well as vertical integration. Producers with their own packing and processing facilities and their own marketing desks are in the best positions to weather the current downturn in grower profitability. Reform of the H-2A program is a very welcome change that will begin benefiting apple producers in 2026, but benefits will be less extreme than headline national averages touting the cost reductions of the program. H-2A wages still cannot go below state minimum wages, and the largest apple-producing states have minimum wages considerably above the national average. While the changes to the program might reduce the cost by a third on average, employers in Washington state providing housing should expect a cost reduction closer to 10%.

Cattle
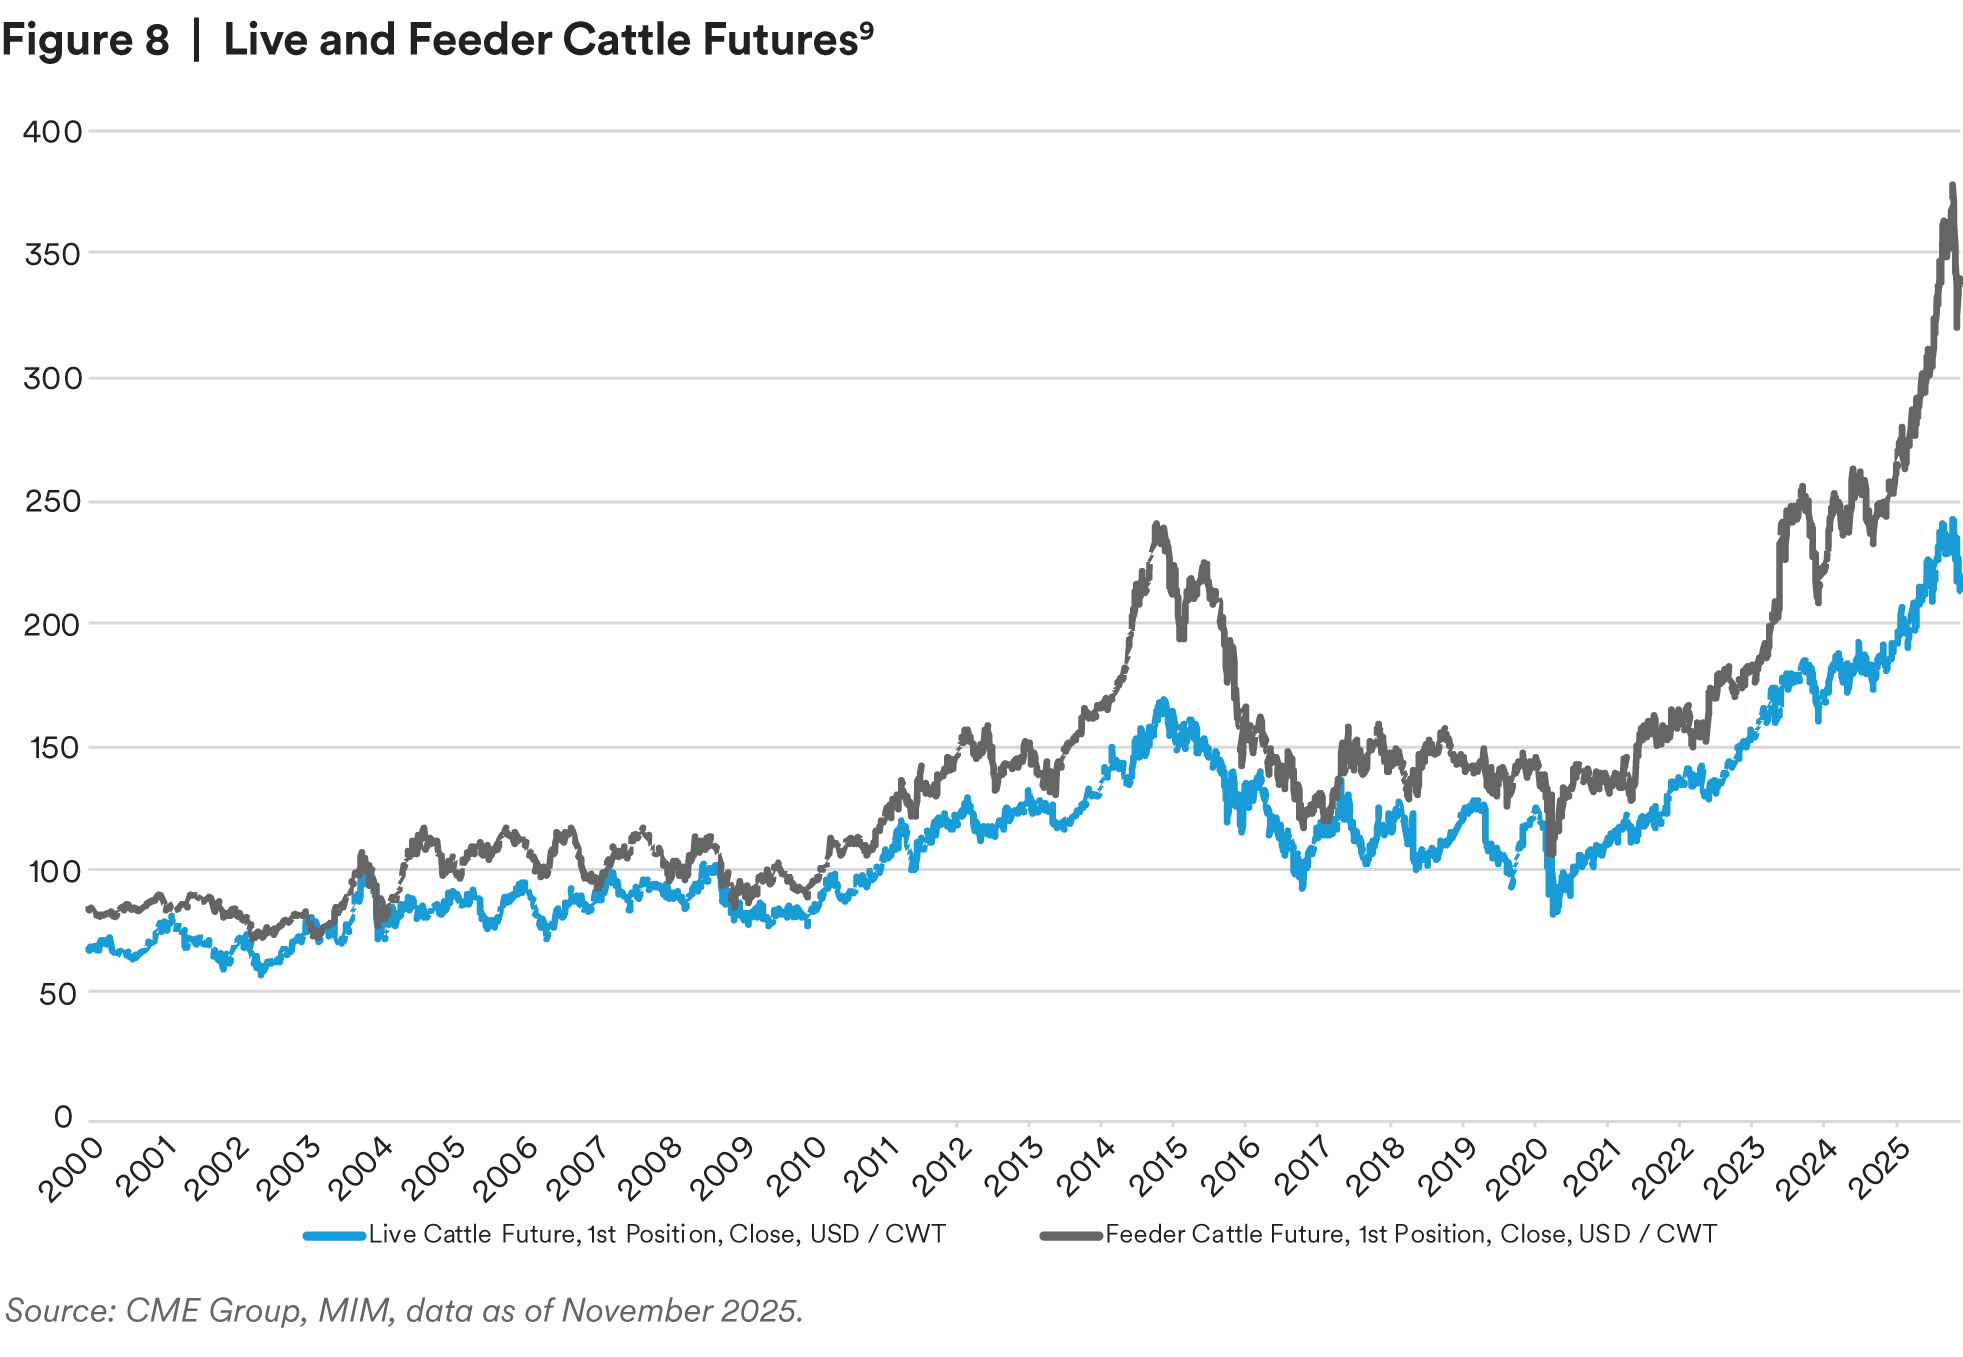
We believe we have already seen the peak of live and feeder cattle prices and expect prices to slowly moderate through and beyond 2026. Should the broader economy slow, consumer willingness and ability to stomach exceptionally high beef prices could wane, resulting in a hastier softening of prices. Similarly, if the U.S. signs a trade deal to meaningfully increase imports from Argentina or reduces tariffs on Brazil, prices may moderate more quickly. Elevated retail prices will continue to provide significant margin opportunities across the value chain, though the distribution of profitability will be shaped by shifting market dynamics. Cow-calf operations and feedlots are seeing record-per-head profits,8 while packers are increasingly competing with each other to secure adequate throughput, placing downward pressure on their margins. For 2026, we expect profitability of cow-calf operations and feedlots to remain favorable with slight moderation from 2025, and profitability of beef packers to trough in 2026 as the herd rebuild reduces quantities.
Swine
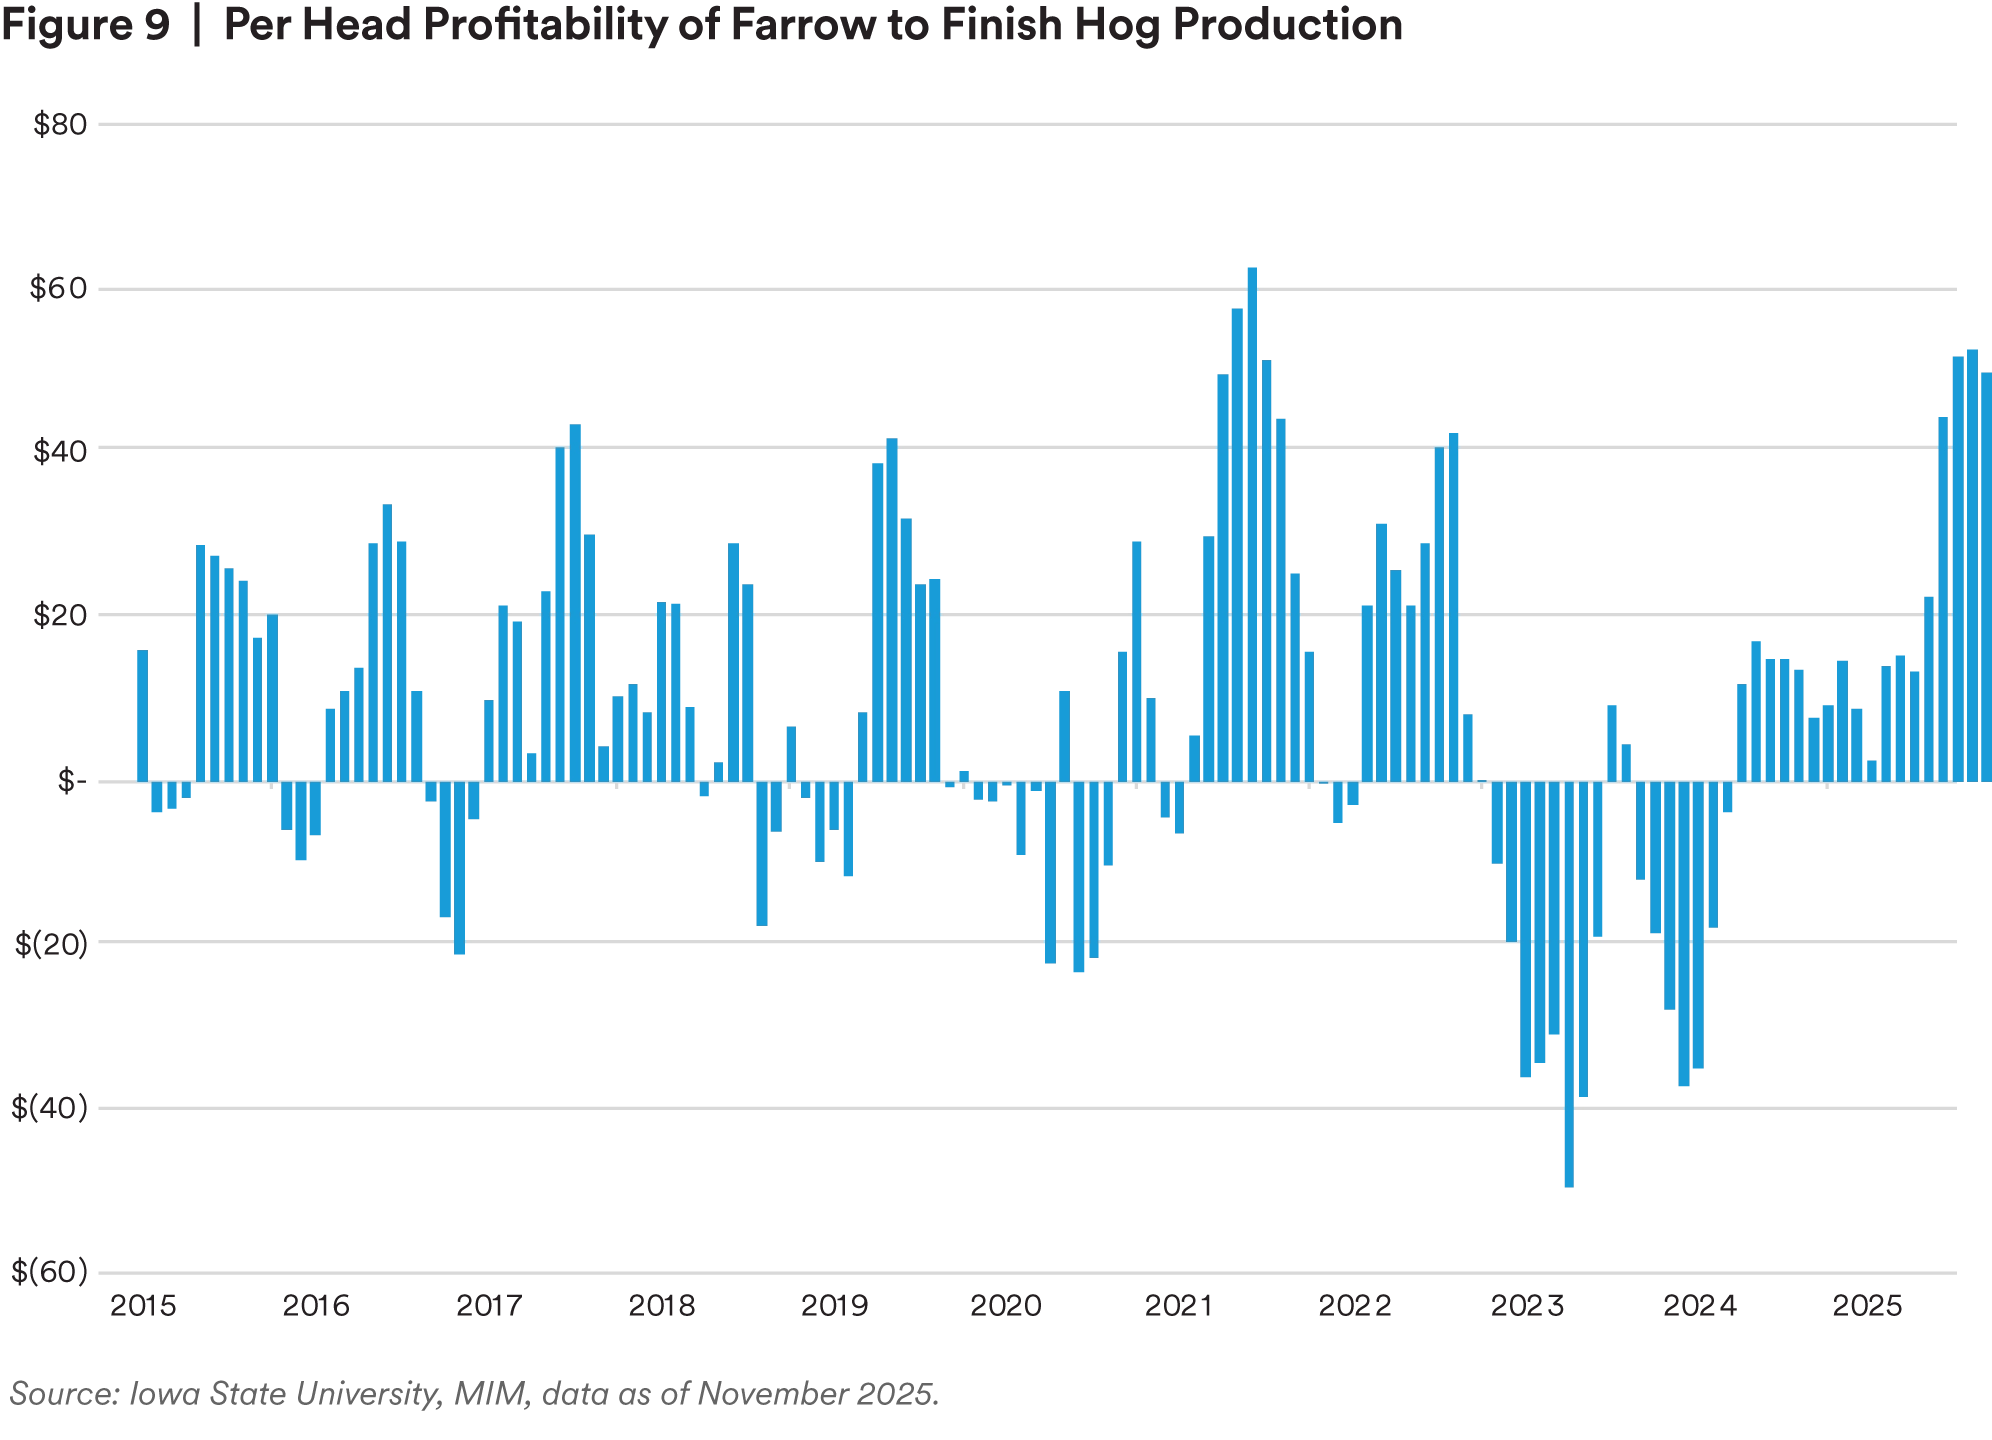
We expect swine profitability to remain strong in 2026, maintaining levels comparable to the rebound seen in 2025. Consumers looking for more affordable alternatives to beef will continue to turn to pork, while an abundance of feed grains will keep feed costs lower for finishing operations. However, an unexpected increase above trend in piglets per litter could cause supply expansion to exceed demand growth and cause profitability to moderate slightly.
Dairy
We expect the dairy industry to maintain its favorable fundamentals through 2026, but profitability will decline modestly compared to 2025. Milk output is projected to climb to 231.3 billion pounds in 2026, driven by modest growth in herd size and per‑cow yields. As a result, the all-milk price is forecast to decline from $21.35 per hundredweight in 2025 to $20.4010 as growing output is not fully offset by demand gains. While prices are expected to decline modestly, feed costs should remain relatively low. Many dairies are increasingly using beef-on-dairy genetics to supplement their milk revenues and targeting the production of milk components rather than fluid milk, and we expect these trends to continue while consumer demand for proteins remains robust. Importantly, legislative developments such as the Whole Milk for Healthy Kids Act have the potential to support Class I fluid milk sales and boost total milk consumption, particularly on a milk fat basis, which could help firm up demand and provide some offset to margin pressures for producers positioned to take advantage of the higher-fat segment.
Cold Storage
We expect elevated vacancy rates to deter new cold storage construction in oversupplied markets in 2026, while demand‑driven projects in agricultural production hubs will continue to be supported by the greater logistical and operating cost efficiencies of newer builds, including lower utility expenses from advanced insulation and energy-efficient refrigeration systems. The industry remains dynamic, buoyed by investment targeting supply chain efficiencies and facility modernization. Significant opportunities persist to replace aging inventory — many regional warehouses still suffer from low ceilings, poor insulation and limited automation. As food distribution demands become more sophisticated, new construction focuses on purpose-built assets with advanced climate control, supporting the rapid movement of perishables from source to market.
Food Manufacturing
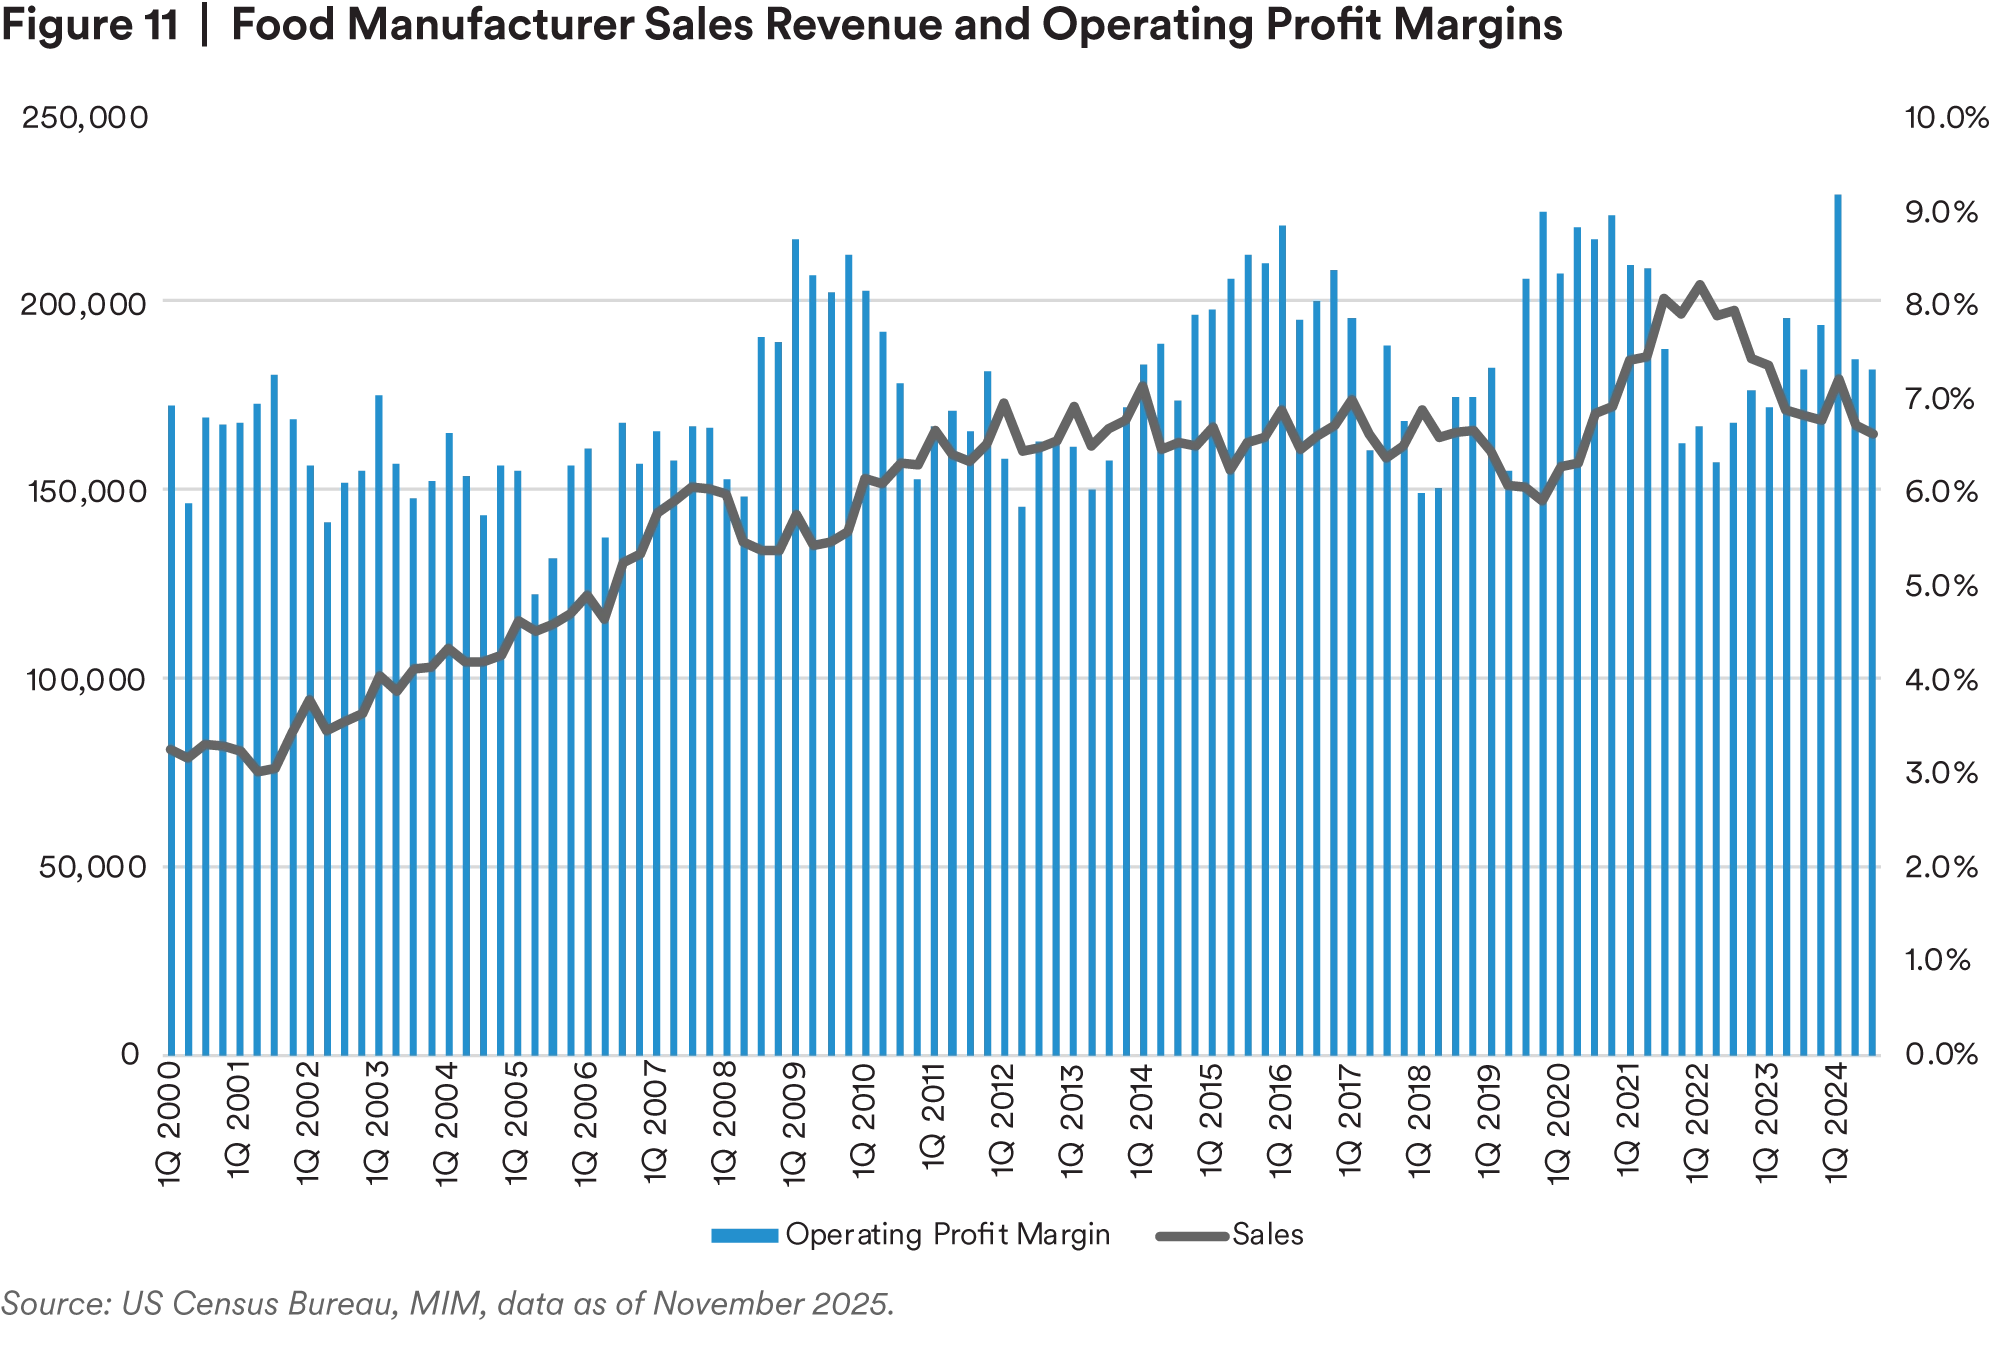
We expect the performance gap in food manufacturing to continue widening in 2026, depending on company scale and focus. “Big food” firms such as Nestlé and General Mills surged during the pandemic, as consumers gravitated toward center-aisle staples and sought out familiar brands. Since then, sales volumes have normalized, but margins remain elevated compared to pre-pandemic averages (Figure 11), aided by streamlined operations and selective price hikes. In contrast, smaller manufacturers and co-ops, particularly those focused on specialty goods or heavily commoditized products, face more margin pressure, as input costs fluctuate and competition intensifies. The industry’s primary risks for the coming year include renewed tariff uncertainty and the potential return of input inflation, with agricultural and trade policy playing a growing role. We also expect M&A activity among large manufacturers to continue — driven by both portfolio reshuffling and a renewed focus on health-forward brands, reflecting changing consumer preferences. Overall, while pressures are mounting, the sector remains more resilient than in prior cycles, bolstered by consumer demand for convenience and premium products.
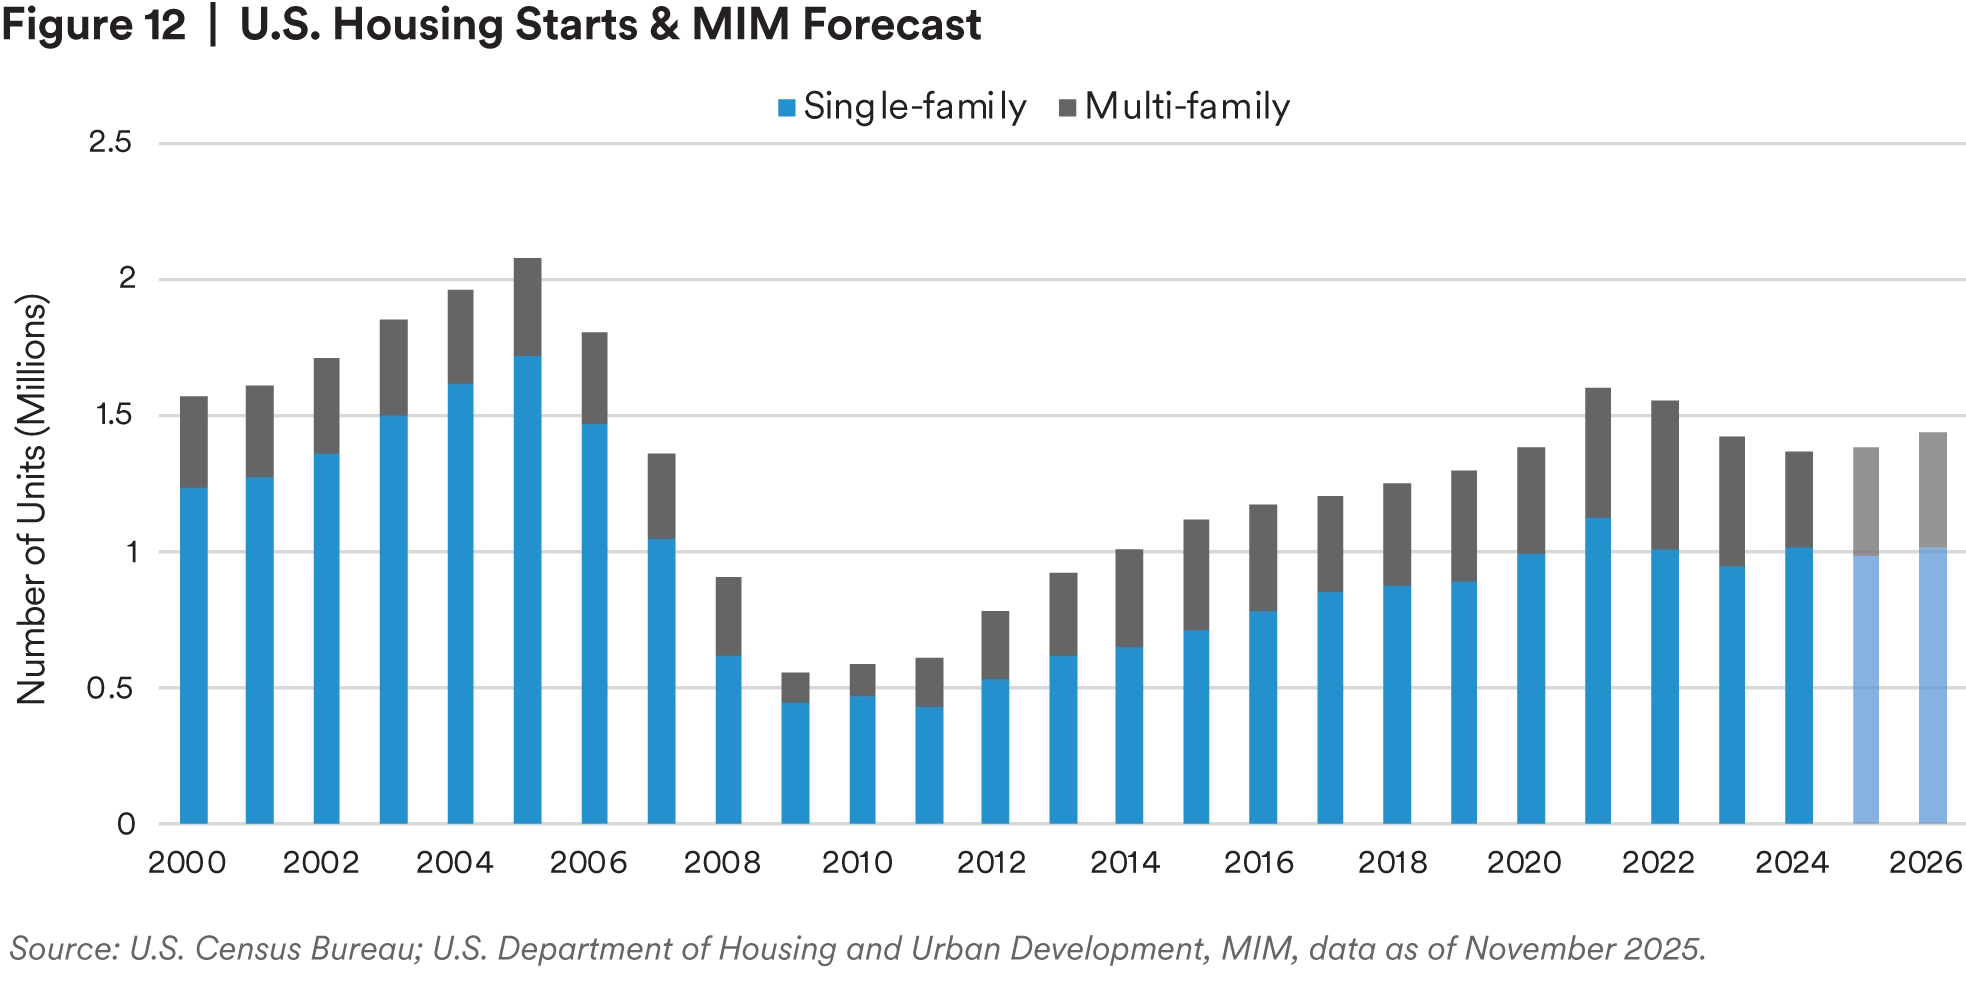
We view the outlook for U.S. timberland sector in 2026 with a sense of cautious optimism, supported by improving fundamentals and evolving market dynamics. We expect southern pine sawtimber prices to stabilize, as recent sawmill investments increase demand in the region, while pulpwood markets will remain challenged due to facility closures and the greater availability of residual chips from sawmills. In the Pacific Northwest, we expect Douglas-fir log premiums to continue narrowing due to softening domestic end-use markets and reduced export demand. Pacific Northwest log prices are expected to trend upward in 2026, as a result of improvements in housing and lumber markets and the region’s tight timber supply. We forecast U.S. housing starts to modestly recover in 2026, supported by lower interest rates and accumulated demand, which should boost timber consumption (Figure 12). This anticipated recovery should support framing products sourced from Southern pine and Douglas-fir. However, supply chain constraints and labor shortages could temper growth. Repair and remodeling expenditures are expected to remain above historical trend levels,11 supported by healthy household balance sheets, an aging housing stock and the mortgage lock-in effect.
We expect institutional investors to maintain strong interest in timberland as a resilient real asset. Capital allocation is increasingly tied to ESG mandates, with timberland positioned as a core component of “natural capital” strategies. Managers report growing interest in carbon sequestration projects and biodiversity-linked returns. Carbon markets are maturing, with verified forest carbon projects contributing meaningfully to investment returns. Renewable energy developers are also pursuing long-term lease agreements for solar and wind installations on cleared timberland, supporting revenue diversity. Retail timberland tract sales to recreational buyers and conservation groups remain active and provide opportunities to enhance returns, though higher rates have cooled speculative activity.
Policy tailwinds include reforestation tax incentives and elevated estate tax exemptions under the One Big Beautiful Bill Act, supporting intergenerational land transfer and long-term ownership. The introduction of 10% tariffs under the Section 232 investigation, combined with the recent increase in Canadian lumber import duties, will continue to put additional pressure on Canadian lumber producers. This will likely lead to additional Canadian sawmill closures, accelerating the shift of lumber production capacity to the U.S. South.
Endnotes
1 Global Agricultural Trade System (GATS) | USDA FAS
2 Corn Futures Quotes | CME Group
3 DTN ProphetX
4 Brazil's E30 fuel mandate triggers gasoline import rush, ethanol spot rally | S&P Global
5 Ethanol explained - use of ethanol | U.S. Energy Information Administration (EIA)
6 Proposed Renewable Fuel Standards for 2026 and 2027 | US EPA
7 Oil Crops Outlook: July 2025 | USDA Economic Research Service
8 Profit Tracker | Drovers
9 Feeder cattle refers to young cattle sold by cow/calf operations to feedlots for fattening. Live cattle refers to older cattle sold by feedlots to meat packers for slaughter.
10 Livestock, Dairy, and Poultry Outlook: September 2025 | USDA Economic Research Service
11 Leading Indicator of Remodeling Activity (LIRA) | Joint Center for Housing Studies