Finding Hidden Gems in Small Cap High Yield
Nov 2026
View available investments in your area

Sorry, we couldn't find any results matching
Please:

Key takeaways:
The small cap high yield bond market is not as well-known as the “traditional” market of larger high yield issues. The companies that issue in this market do not appear frequently in news headlines or have dedicated research analysts at large Wall Street firms covering their every filing or news event. Small cap high yield managers must do on-the-ground research, tapping non-traditional data sources and developing deep industry knowledge to learn about their issuers.
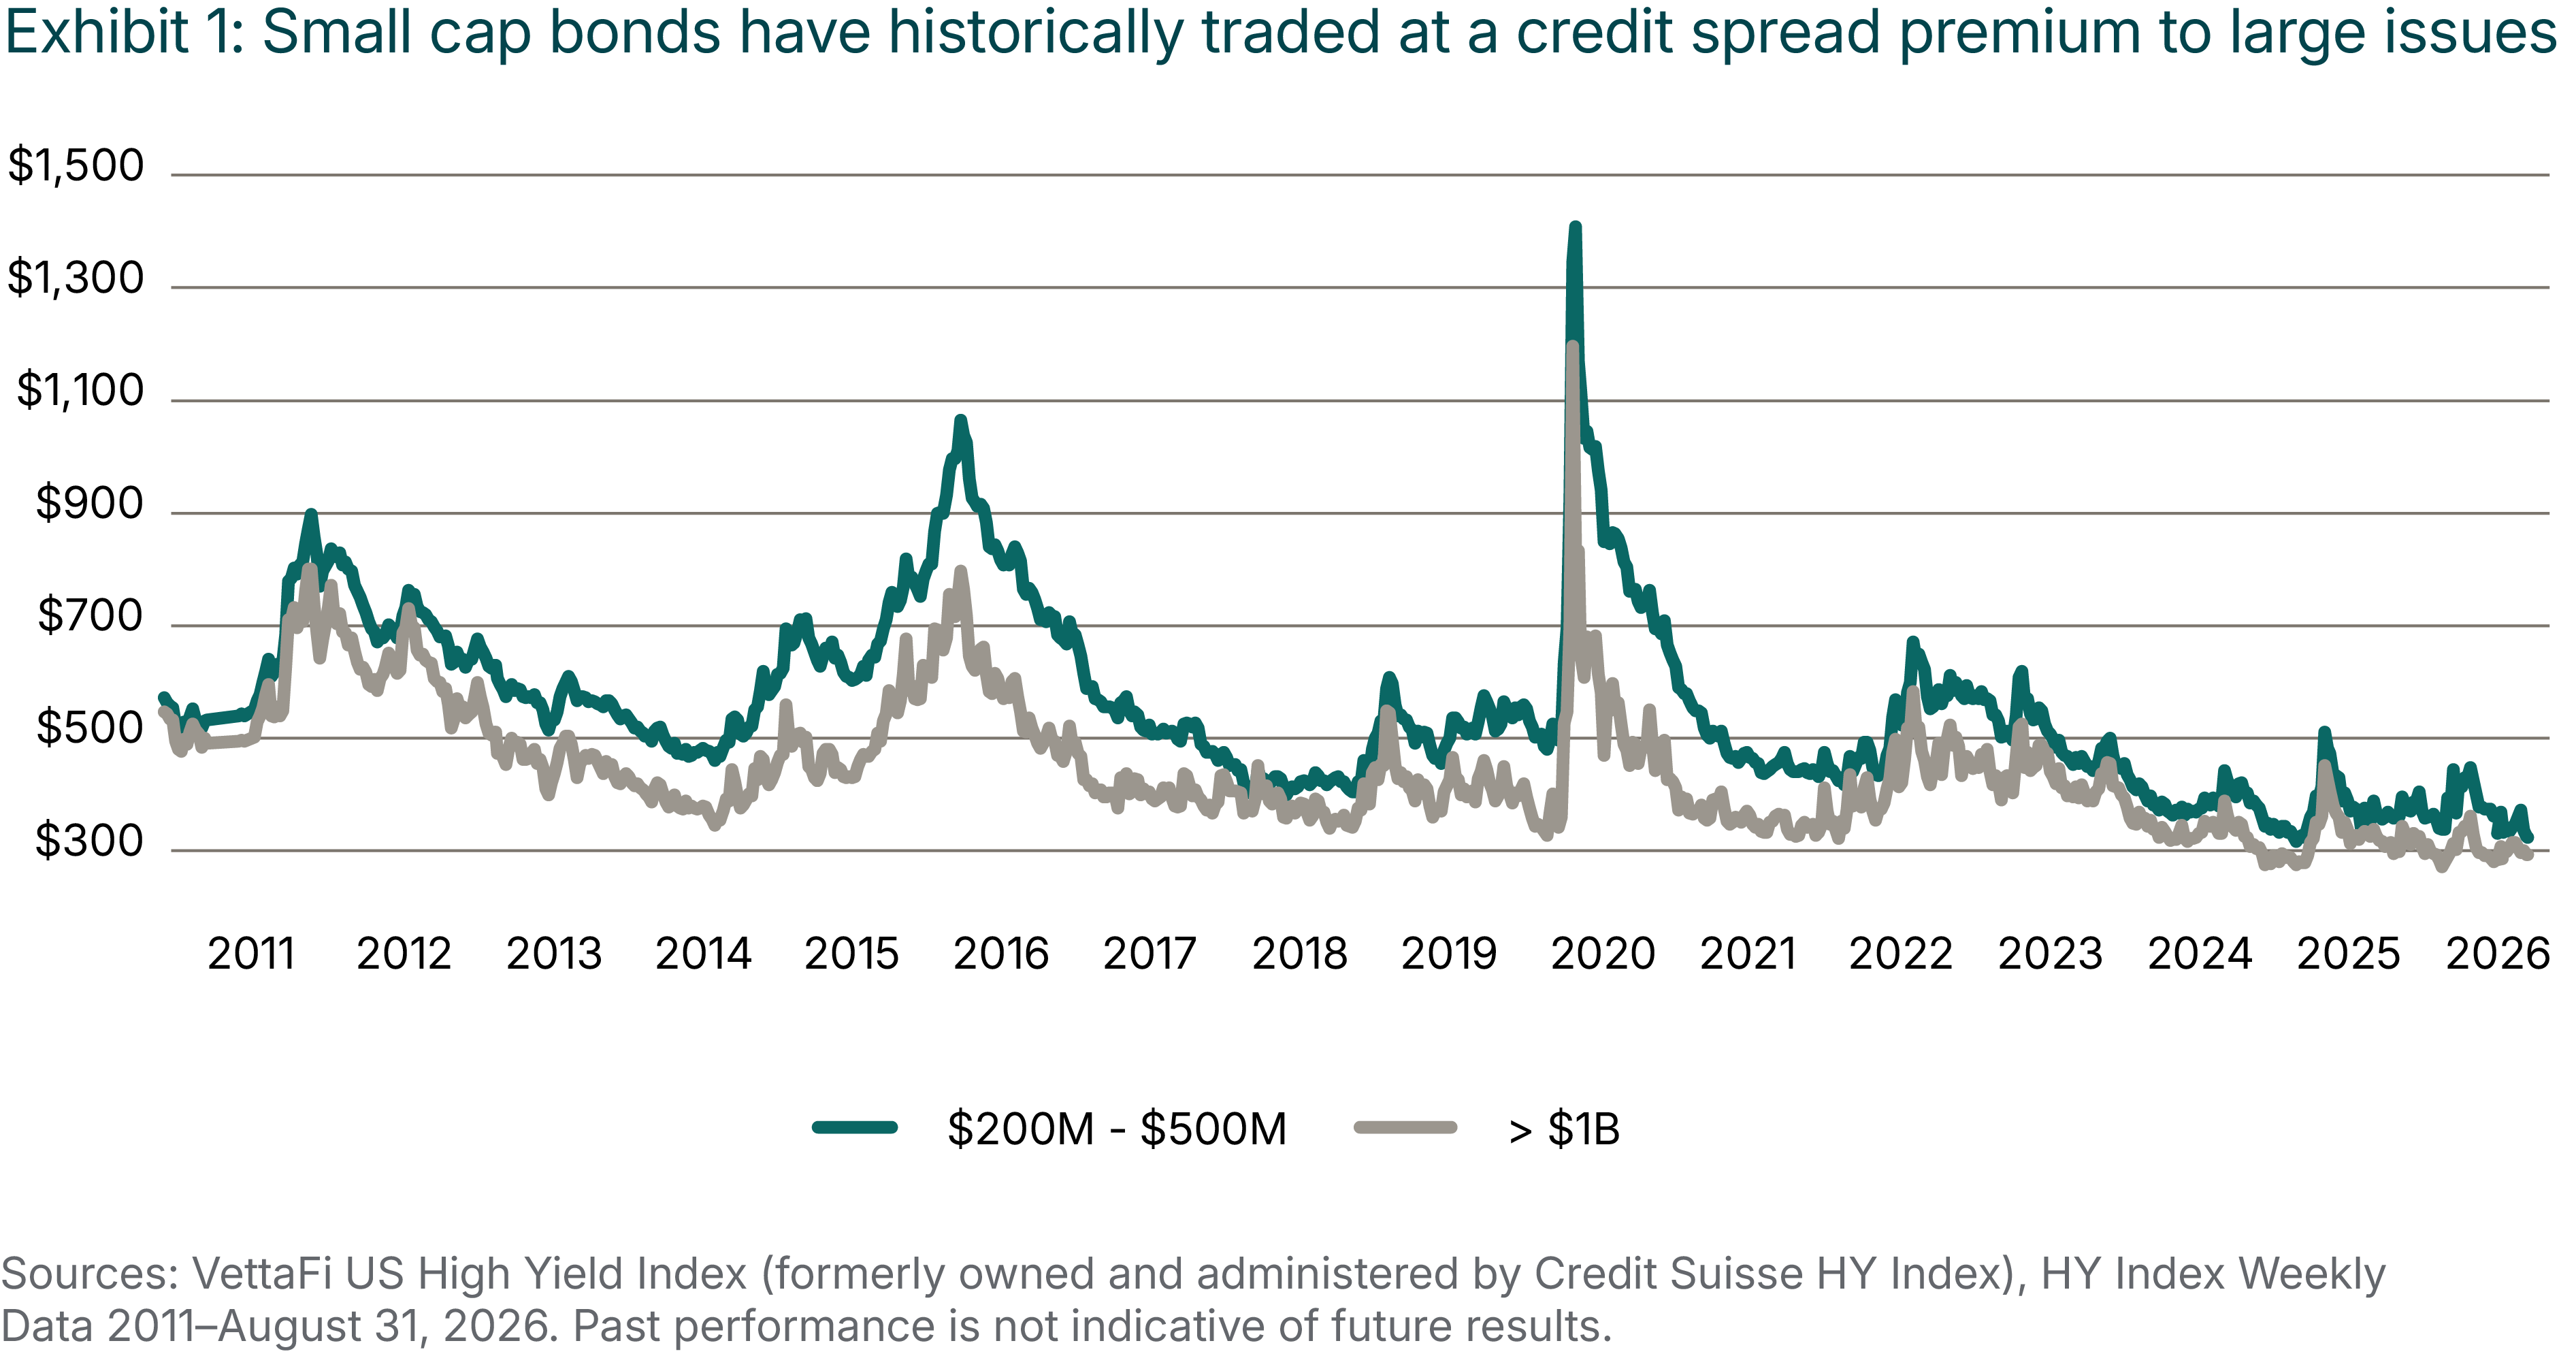
We think this relative lack of information creates inefficiencies that managers can exploit to drive excess returns. Over the years, our research has shown that small cap high yield bonds trade an average of 112 basis points (bps) wide compared to their large cap counterparts,1 with lower volatility,2 lower correlations to U.S. equities and investment grade bonds,3 and lower default rates4 over the long term.
We’ll take a closer look at the attributes of this lesser-known asset class and examine why investors may have historically overlooked it.
Higher income
The 112-bp average gap between spread-to-worst yields of small cap and large cap high yield bonds is not terribly surprising, in our view (Exhibit 1).
Forming an opinion about a company’s value that rises to the level of conviction is a difficult task. Asset managers looking at a new bond issue tend to compare the new issue to issues they already own or know well. Large cap high yield issuance is easier to know well. Data about large, household-name companies is typically much more accessible through equity research, news coverage and research from industry consultants. Asset managers also have access to experienced industry professionals that can provide granular knowledge of firms. In many cases, these professionals have worked for the firms about which they provide advice. In a large industry with multiple existing high yield issuers, analysts can readily compare key credit and performance metrics across similar companies, correlate those metrics to the observable trading levels of closely comparable securities and readily form an estimate of relative value in which they can be quite confident. They begin with a built-in base of industry knowledge and experience.
Conversely, small issuers5 tend to be much less known and to come from industries with little or no prior presence in the high yield market, making reliable data about the issuer and its industry harder to come by. Analysts must do a lot more work to form an estimate of value and may have less confidence in that estimate than they would if a market consensus already existed. The analyst may have to physically visit the company and interview its suppliers and competitors to become really informed. When investors are not confident in their valuations, they rationally build in an extra margin of yield. We call this the “unfamiliarity premium,” and we believe it is a key source of value in small cap investing. If fear of the less known drives yields higher than what is necessary to compensate for the true default risk of the security—not merely the feared or perceived defaultrisk—the conditions for outperformance are present.
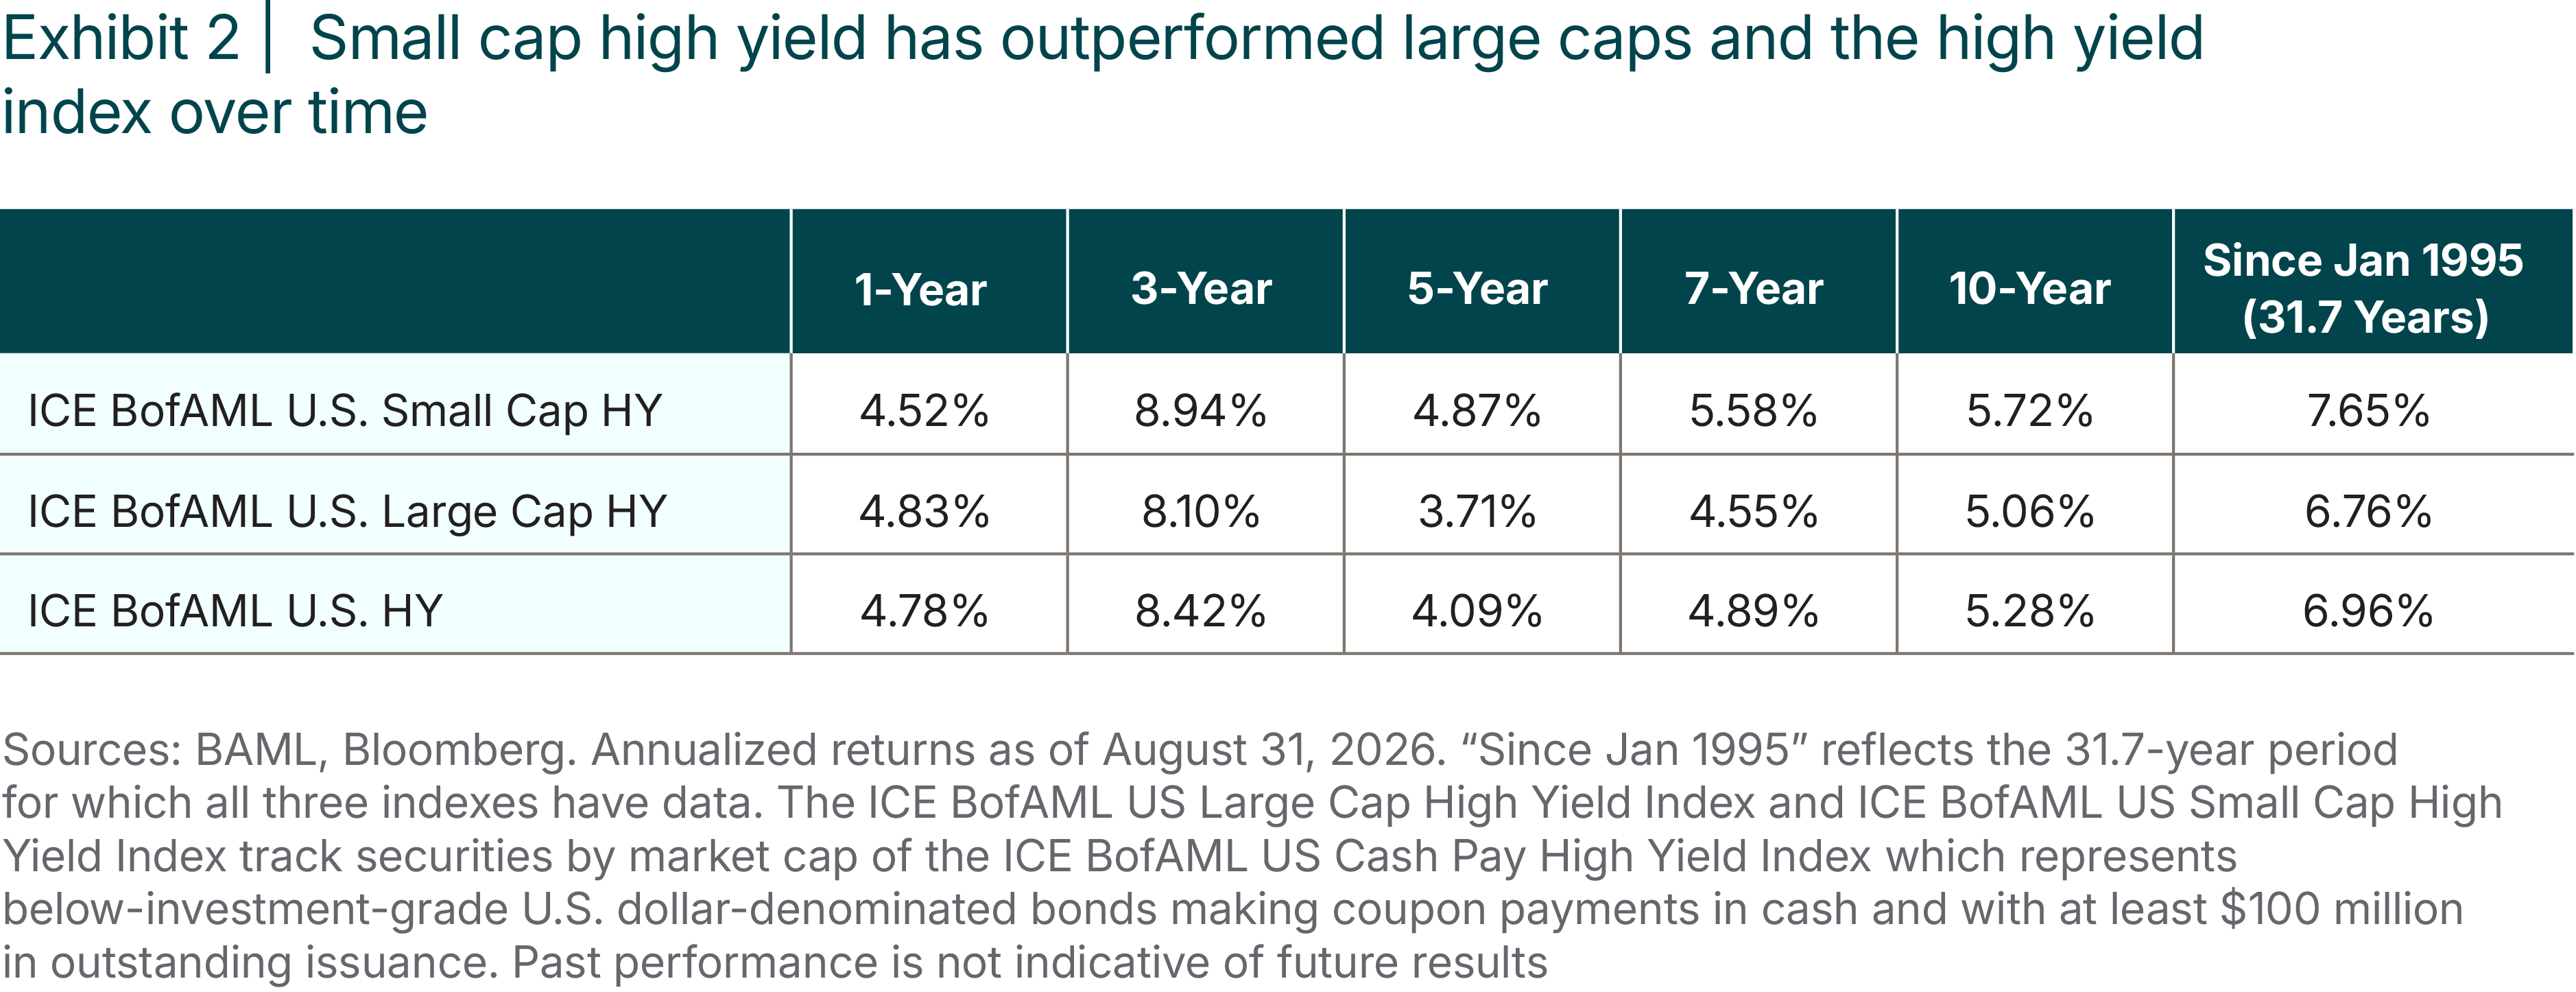
Promised yields are attractive, but what really matters to investors are the realized returns after all the non-coupon influences on a bond’s economics: call premia, tender premia, changes in spreads which affect current values, and, most importantly, the frequency and severity of defaults. On this basis, small cap bonds have again consistently outperformed large cap bonds, as shown in Exhibit 2.
Lower default rate
Why does the significant difference in yield and returns between small cap and large cap high yield bonds arise? Many investors steeped in efficient markets theory infer that the extra yield must be compensating for some incremental risk in small bonds, and in high yield the most obvious risk is default risk. They have an intuitive belief that large firms have lower default rates, which certainly sounds like a reasonable premise. In everyday life, restaurants and small retail shops fail much more often than large corporations. These investors share a view articulated by the rating agencies that large firms have better access to the capital markets, better management teams and generally more levers to pull if their financial situations turn precarious.
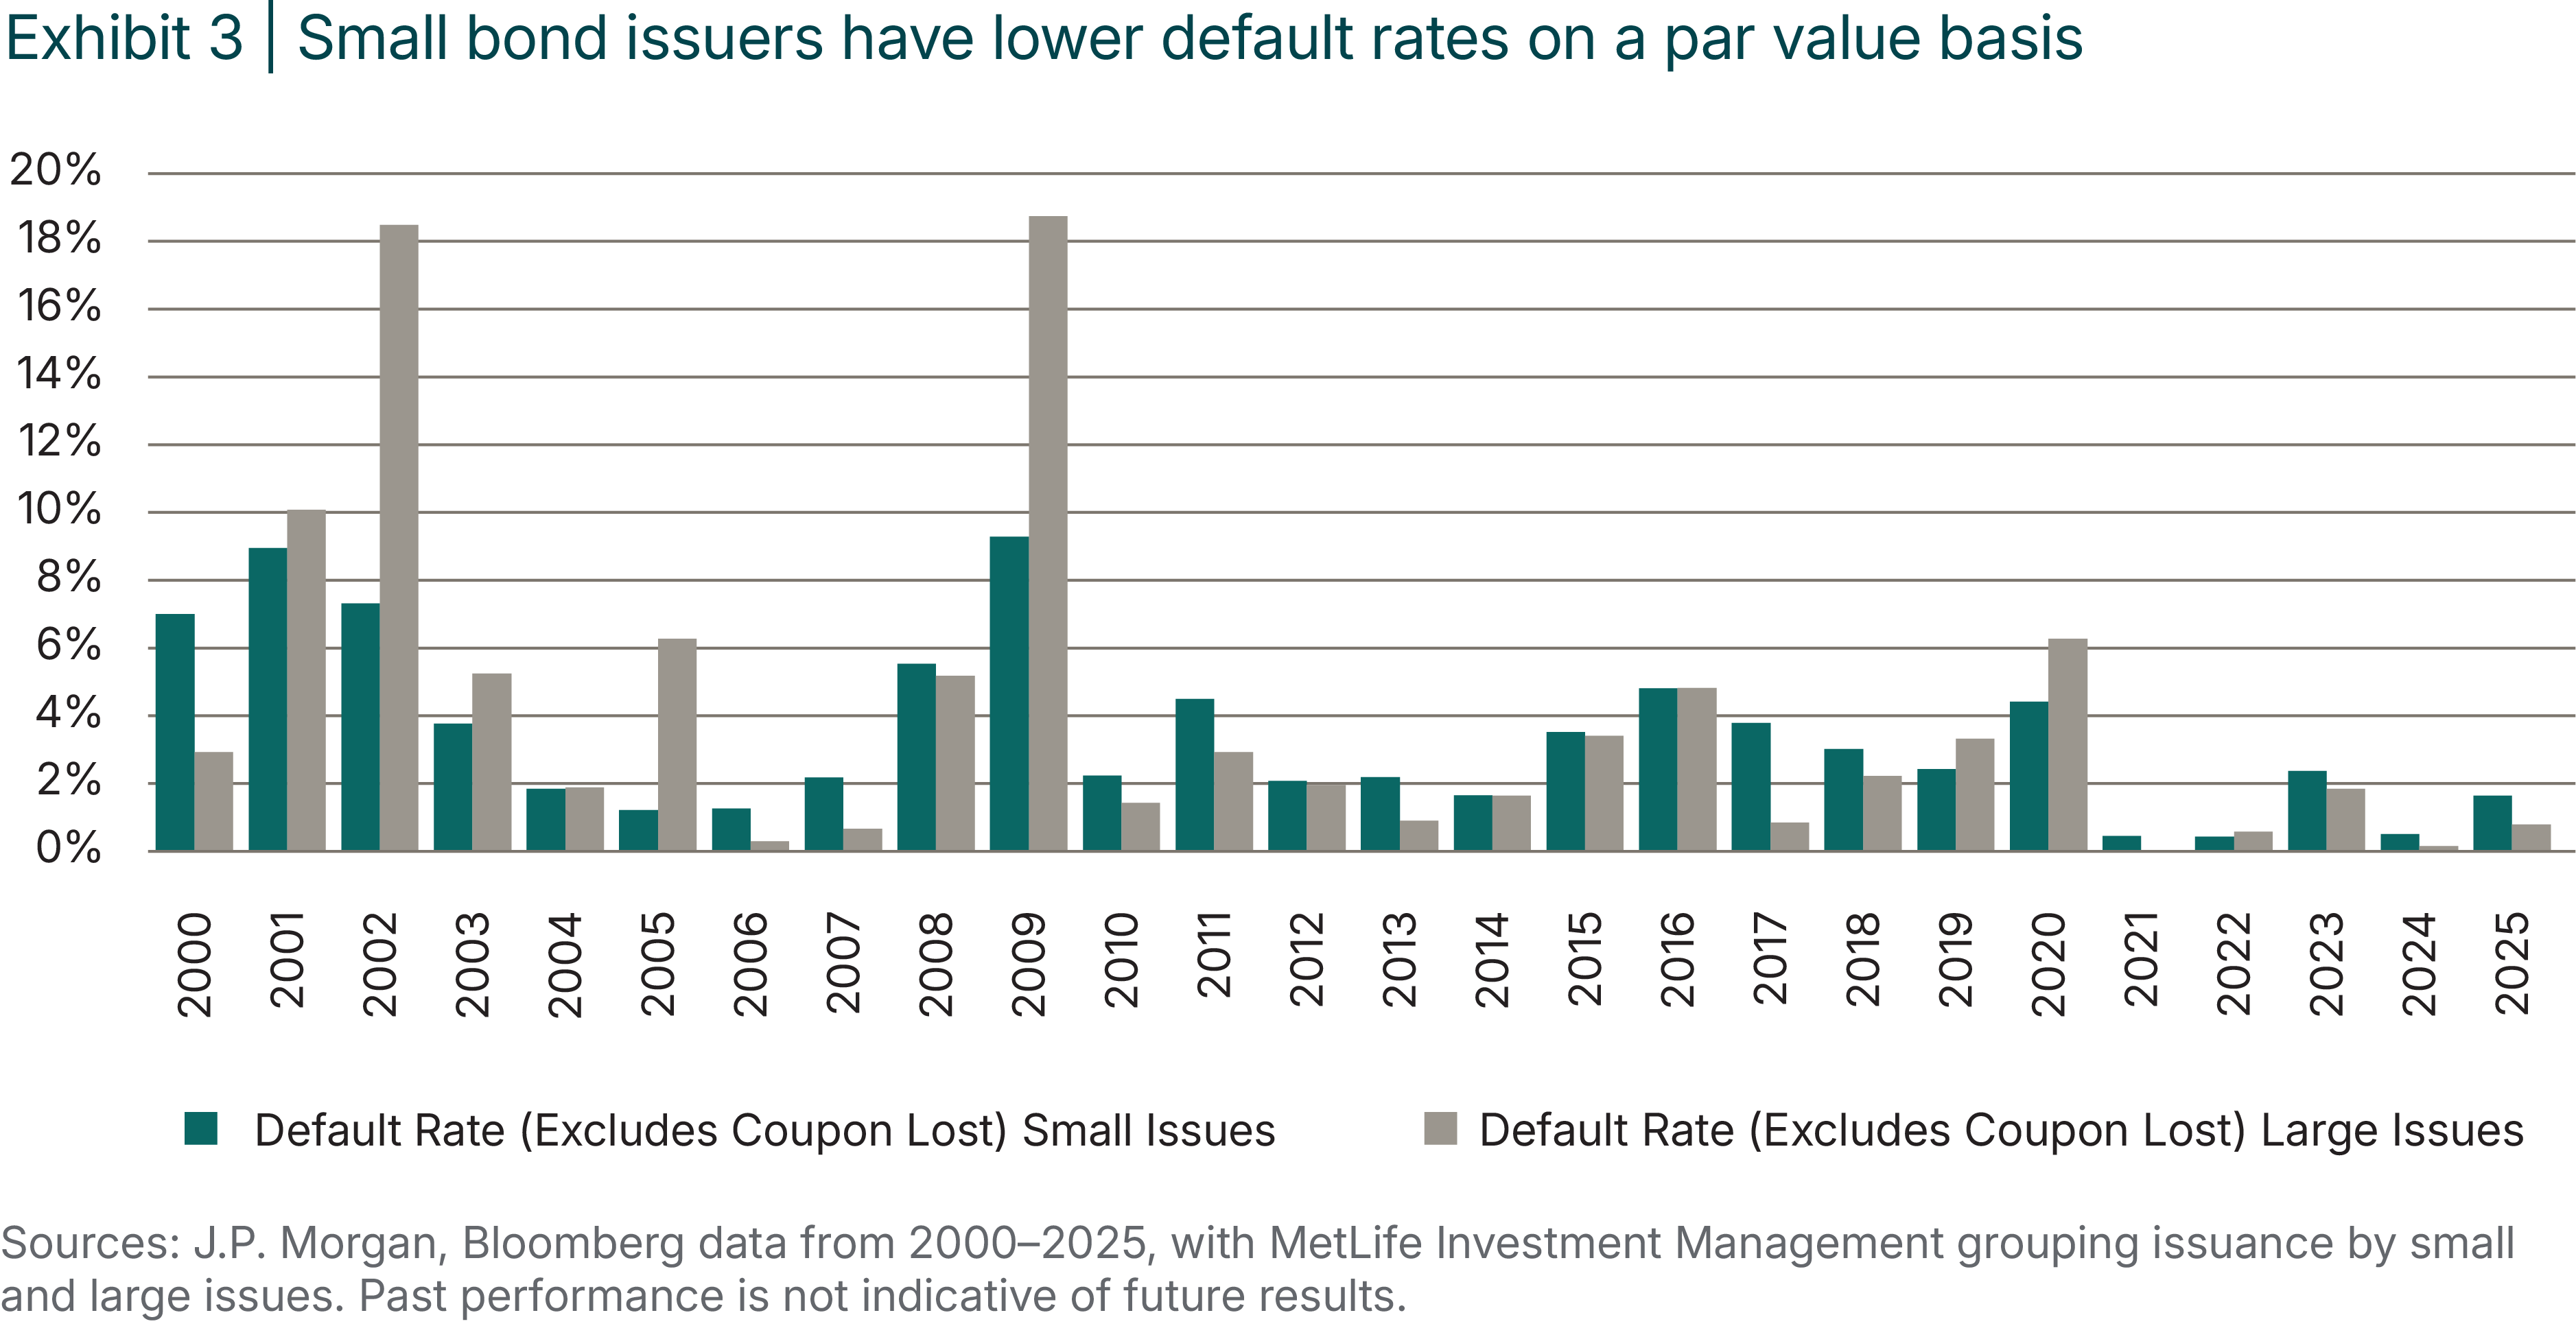
But the big-is-better thesis is wrong. Our own research shows that small caps have a lower long-term default rate when measured by par value rather than the number of defaulting issuers (Exhibit 3).⁶ From 1999 to 2025, small cap high yield bonds experienced a 14% lower default rate than large bonds, with an annual average default rate of 3.4% for small bonds over the period compared to 4.0% of par for large bonds. Notably, during the two particularly stressful years of 2002 and 2009, the large cap default rate was more than double that of small cap bonds. This means that if we calculated the overall default rates on a dollar-weighted basis instead of weighing each year equally, which is the conventional way default studies are structured, the relative resilience of small cap bonds would be even more marked.
We intentionally measure defaults using par value rather than issuer count, another common method used in several sources of default statistics. Tallying defaults by the number and percentage of defaulting companies implicitly treats all default events as equal in importance, while par value weights defaults by their size and reflects what investors, as a whole, experience in their portfolios. Enron’s default on $31 billion in debt and Worldcom’s default on $41 billion each inflicted more losses on many investors of lesser-known small cap high yield issuers added together. All studies of defaults and what drives them in our view should be weighted by dollars, not event counts. Indexes like the S&P 500 or the Bloomberg High Yield Index are rightly weighted by market capitalization because they reflect the weighted average of the actual returns investors experience, and we follow a similar approach in considering defaults.
Another way in which our study departs from others is that we do not set static cutoff points, in dollars, to differentiate small cap, mid cap and large cap bonds. The size of the market and the average size of bond issues have grown significantly over the years. In 1999, when our study began, a $400 million bond was considered a large cap bond. Today, a $400 million bond is considered a small cap bond. A $400 million bankruptcy in 2025 would go into the “small firm” column, whereas a default of the same size in 1999 would have gone into the “large firm” column. This introduces a large and fatal error into any study anchored to static cutoff points. For any study spanning enough years to provide meaningful results, sizes must be normalized to account for the growth.
We solve this with a dynamic approach that re-sorts bonds into quartiles at the beginning of each year. Thus, an issuer which sold a $500 million bond in 2003 might have been a comparatively large issuer at that time, but midsize by the time it defaulted in 2010. We would count that default in the appropriate midsize category, at the time the default impacted investor returns.
Lower volatility
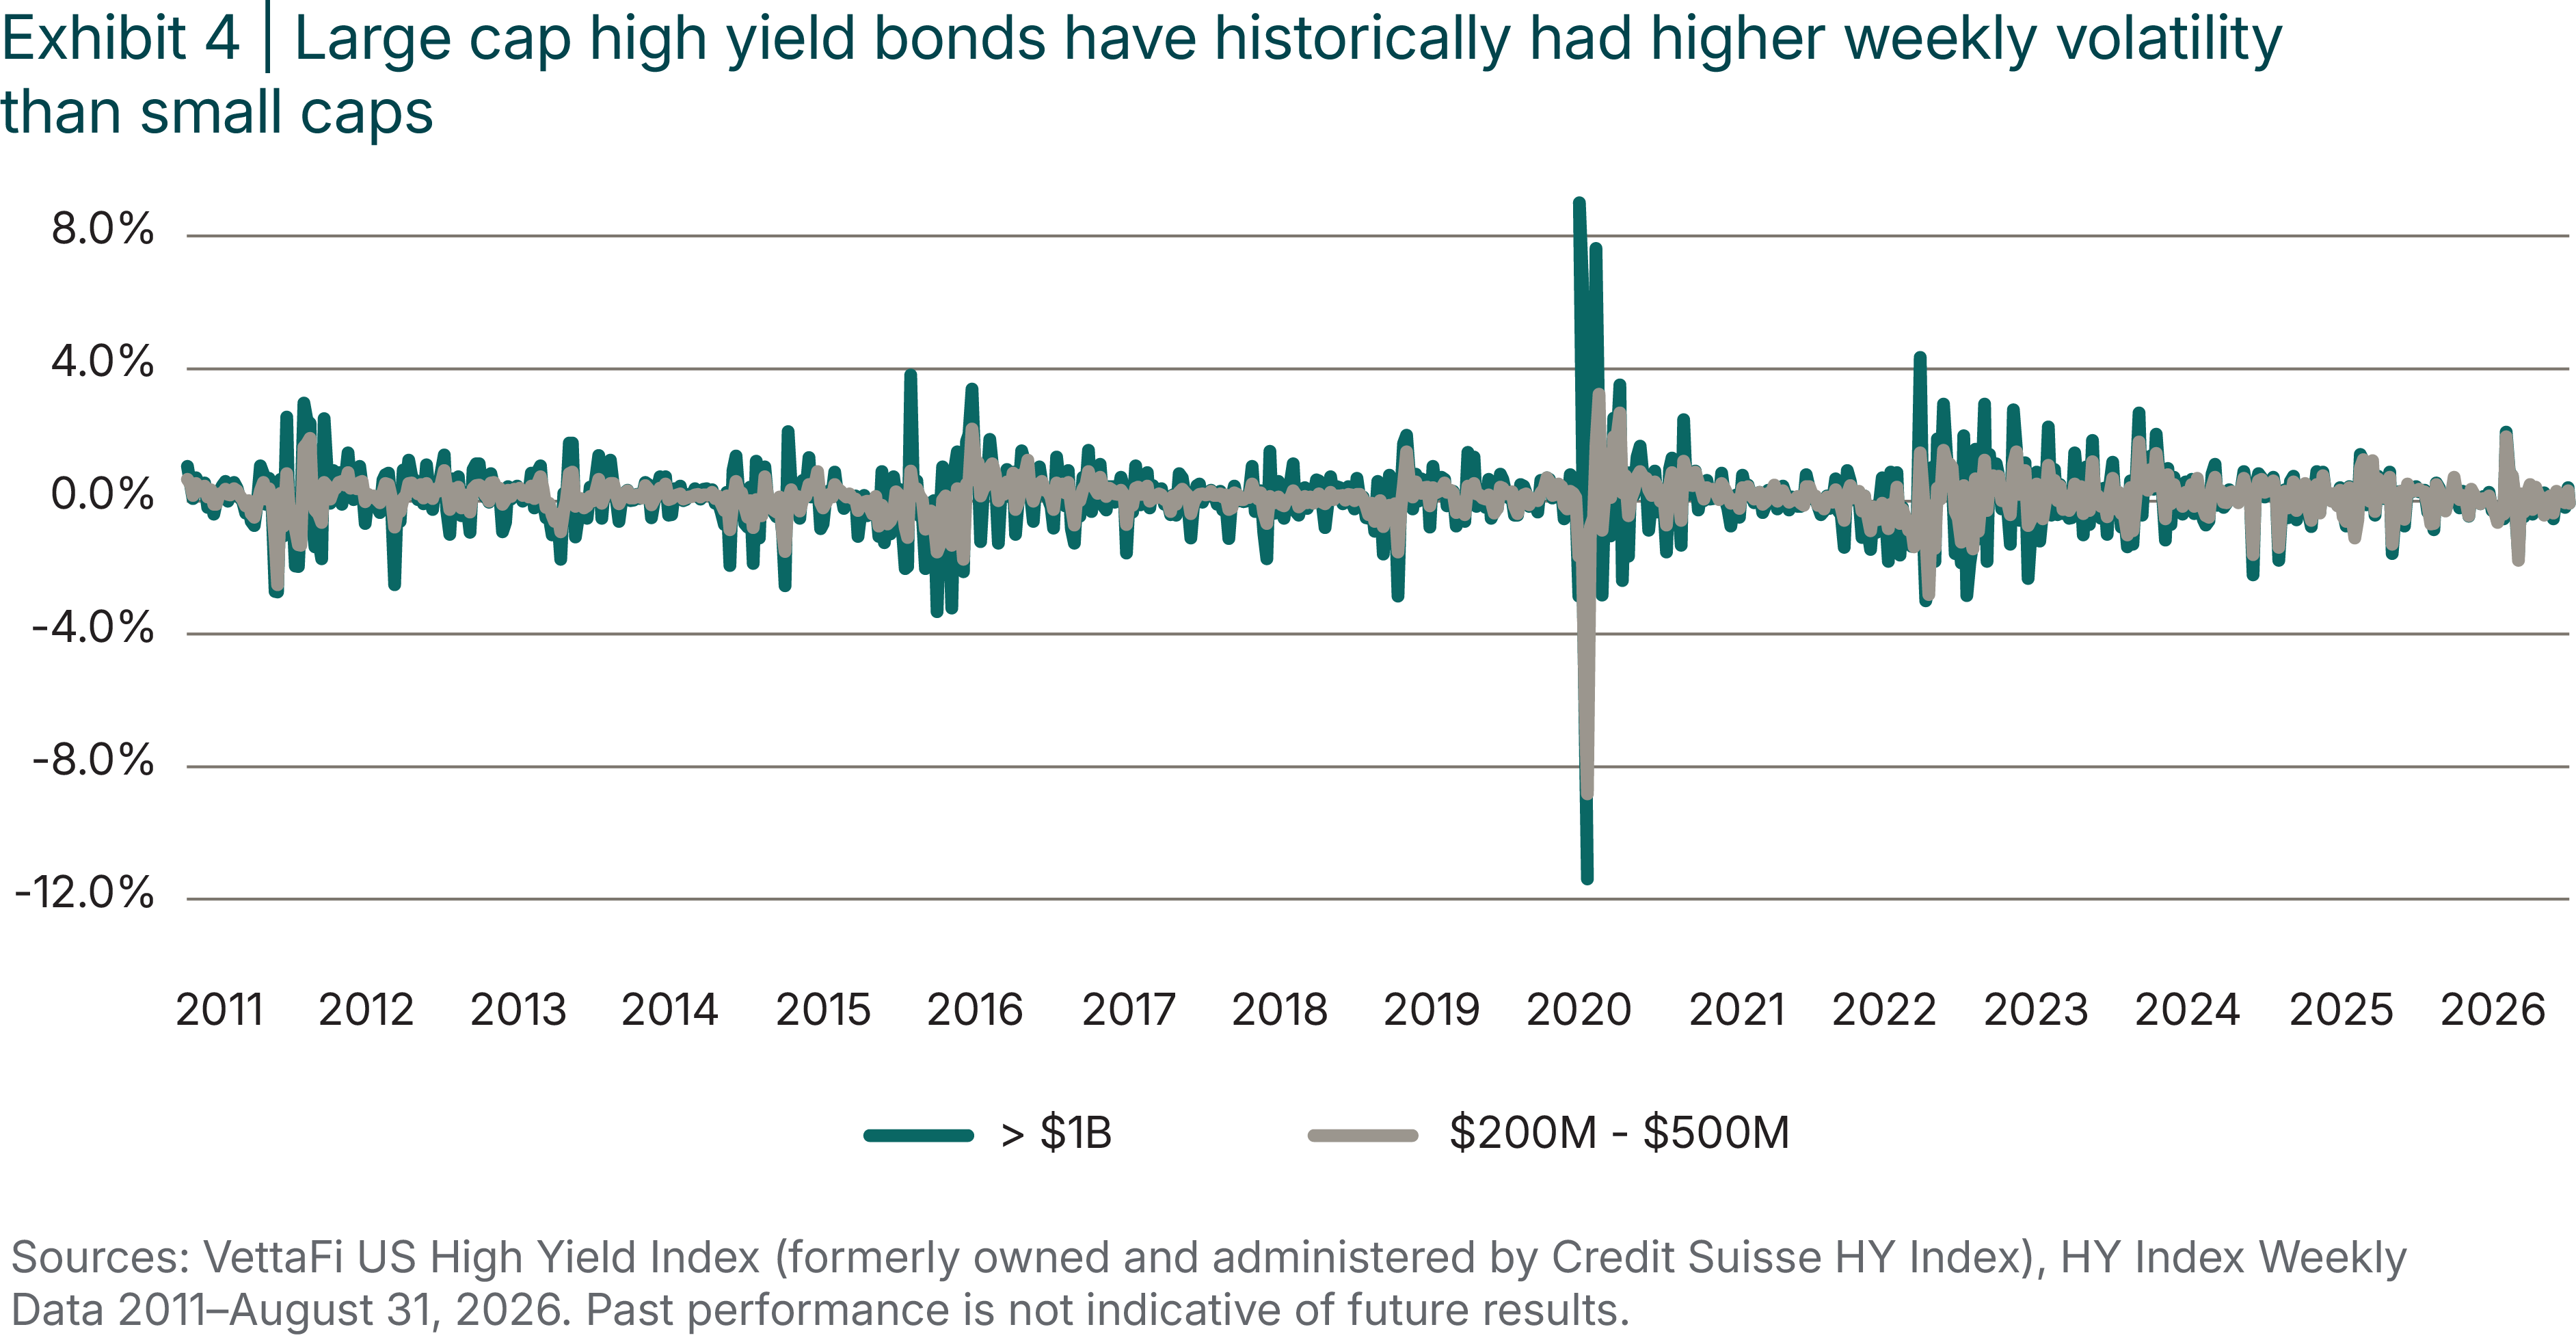
Though often seen as the safer area of the high yield market, large cap bonds are in reality much more volatile on a week-to-week basis than small cap bonds, with respective return standard deviations of 1.12% vs 0.68% (Exhibit 4).6 If we use a monthly return periodicity and annualize it for ready comparability to other asset classes, the striking result is unchanged: Large cap volatility was8.25% during the period 2011 to 2026, and small cap volatility was 4.89%
The explanation for this finding is relatively straightforward once investors think about the effect of large flows in the market. Time-sensitive investors who demand fast execution — mutual fund investors redeeming shares, for example — impose much larger demands for near-instant liquidity and thus managers of those funds tend to favor large bonds. Large cap bonds, which are easier to borrow for the purpose of short selling, also attract the attention of hedge funds that are trading very actively. Our prior research shows that their preference for large bonds ultimately creates higher-than-average liquidity costs, in the sense that large, urgent trading moves prices and thus imposes indirect trading losses which are borne by whichever side of the trade is acting under a greater sense of urgency. We’ll describe these findings in more detail later. Importantly, the rapid-fire trading caused by “hot money” entering or redeeming creates volatility borne even by buy-and-hold investors who are not liquidating their shares out of the selling mutual fund. Economic value, rather than immediate money flows, tends to govern the prices of small cap bonds, which results inmore market value stability.
Diversification
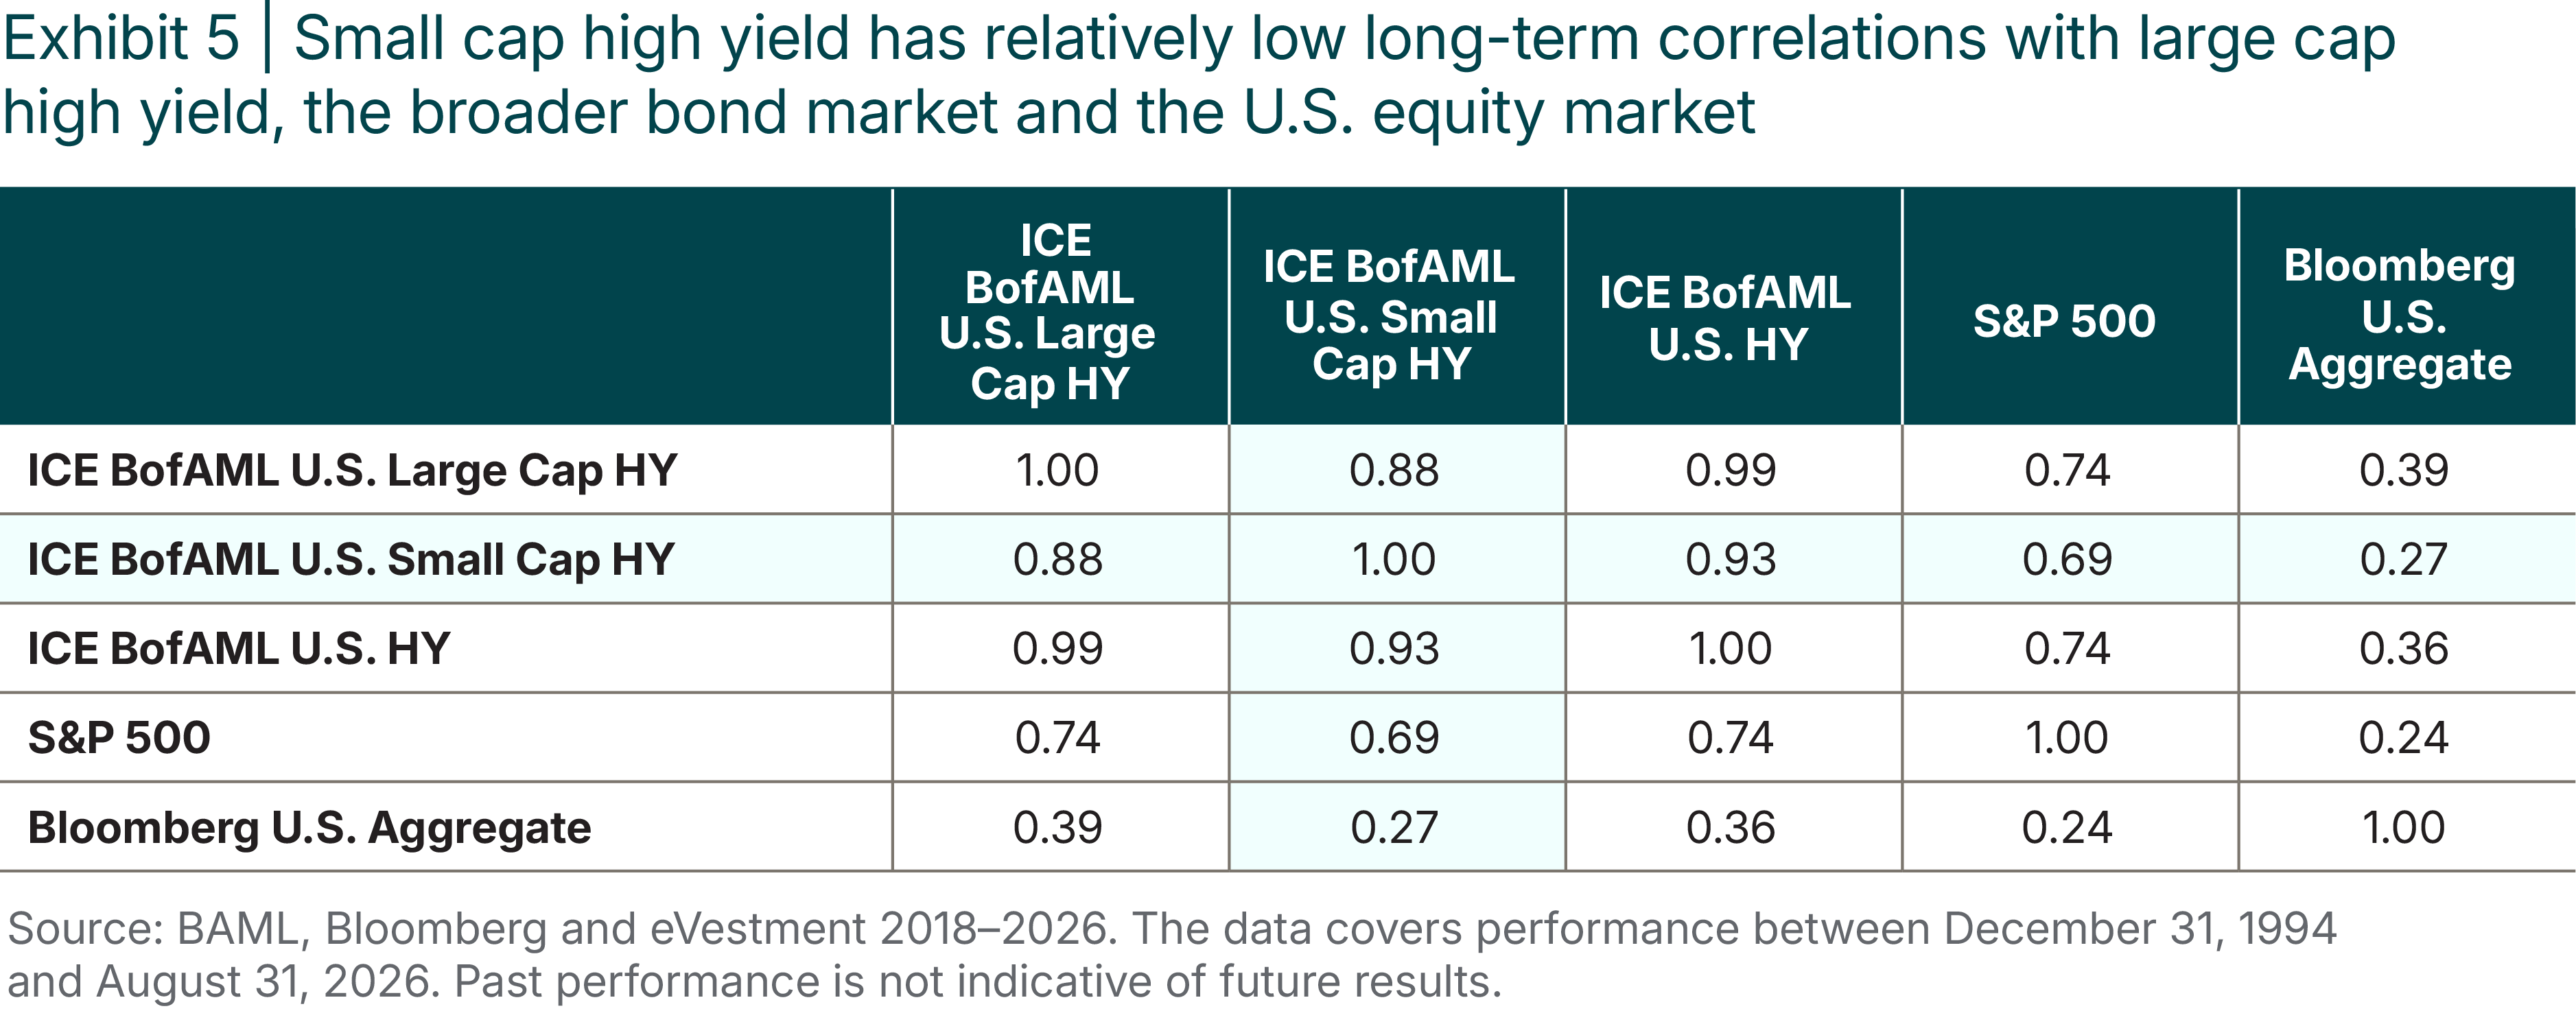
The ICE BofA US Small Cap HY index demonstrates the added diversification benefit of small cap high yield for those also investing in U.S. equities or investment grade debt. High yield debt, as a whole, is a good diversifier vis-a-vis the investment grade and equity markets, but small cap high yield is modestly more diversifying than large cap (Exhibit 5).⁷
So, why is no one paying attention?
Given all the potential advantages offered by the small cap high yield market, why do the inefficiencies in the market persist? We have a few theories.
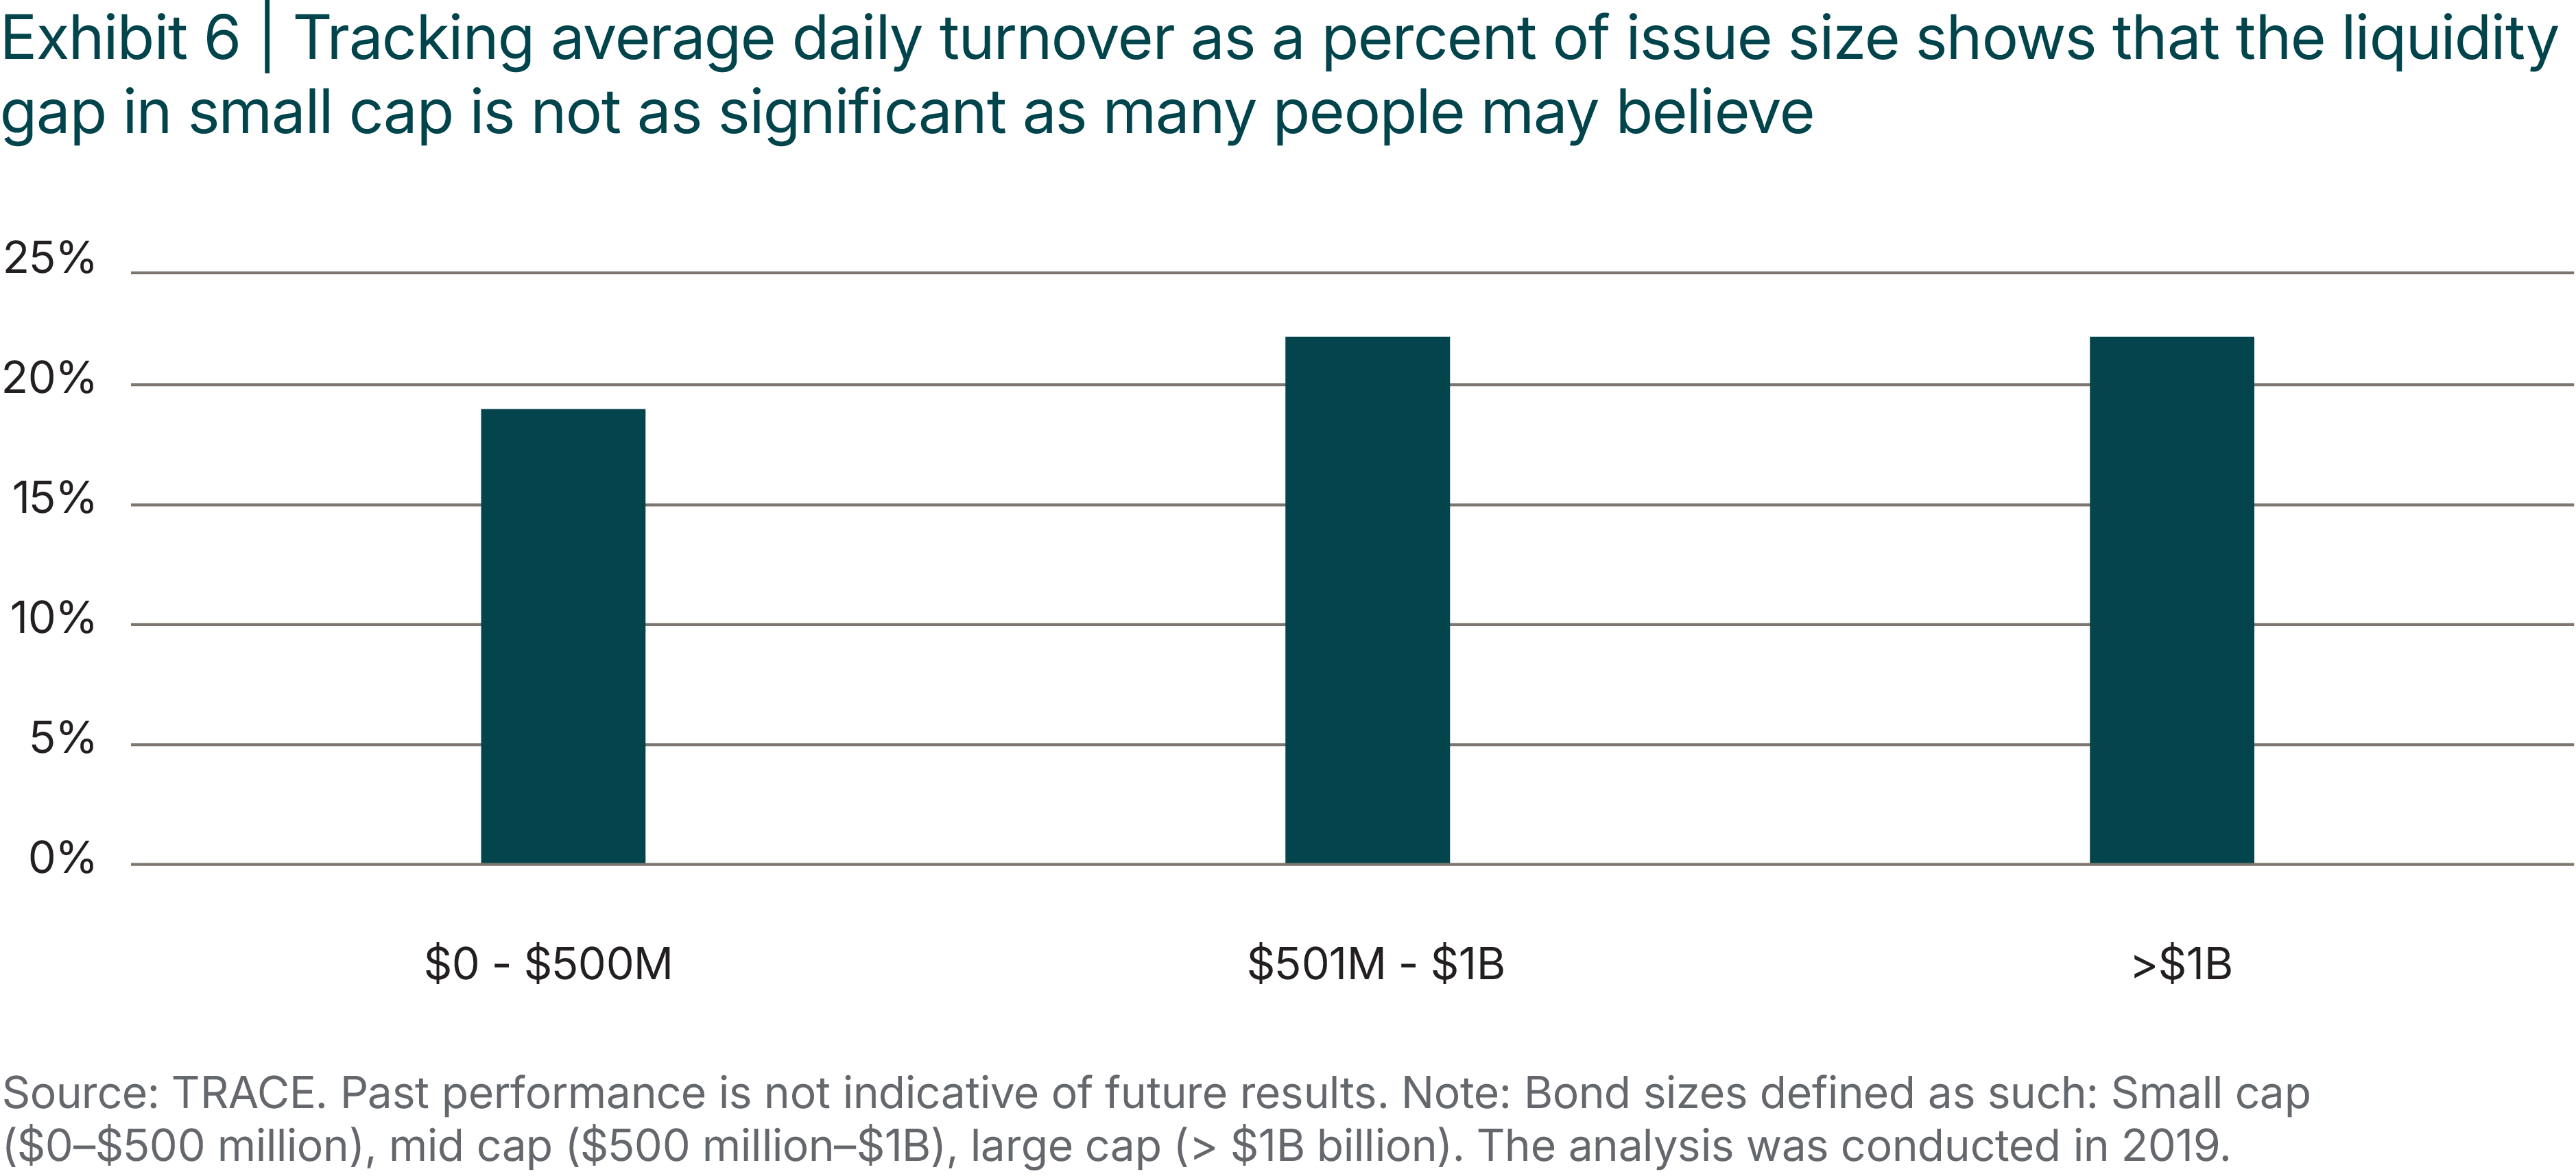
When investors think about the cost of illiquidity, they are usually wondering if they can convert their entire portfolio into cash quickly without discounting the price. At the request of a large client in 2019, we once modeled such a liquidation of its small cap portfolio, using the actual average daily trading volume for each bond and assuming that we would merely respond to naturally occurring bids and confine our own sales to 35% of that daily average trading volume. The idea was that this sort of trading rule would ensure that our own act of selling, at a measured volume into the normal flow, would have no impact on the prices received. The portfolio contained 118 names, more than half of them being in small cap bonds (up to $500 million), 28% mid cap bonds ($500 million-$1 billion) and just 8% in large cap bonds (greater than $1 billion).
The result: We determined that we could sell 36 percent of the portfolio in one day, 69 percent in three days, 82 percent of the portfolio in five days, 93 percent of the portfolio in 10 days, and 97 percent of the portfolio in one month, which in our judgment is plenty of speed for a large client, like a pension fund, which tends to make asset allocation or manager changes at a measured pace. Even more interesting is what happened the same year when we performed the same modeling for a hypothetical portfolio identical to ours in the number and size of positions, but with the “market” blend of large, mid and small cap issues —45% small cap, 37% mid cap, and 18% large cap bonds. At each milestone (one day, three days, five days and 10 days) the cumulative sales of the purportedly illiquid small cap portfolio trailed the “market” portfolio by only 5 percent. That is to say, there was only a very slight relative delay to the liquidation exercise for the small cap portfolio.
How much could that delay have cost our client in terms of sale proceeds? Even at the height of the Covid sell-off in March 2020, when the market fell by roughly 1% per day, the incremental cost of the slight delay amounted to just 0.15% of the portfolio value. We believe that this one-time penalty is the true maximum incremental cost for holding a small cap portfolio. Compared to the yield advantage of 112 bps per year7 from holding small cap, the true incremental liquidity cost is, in our view, trivial. That’s why we believe small cap investors are adding true risk-adjusted excess return by capturing the “unfamiliarity premium,” rather than compensatingfor illiquidity costs that may be far less than they believe.
3. Larger investors prefer the scale and plentiful information in the large cap universe. For the largest high yield investors managing funds of $10 billion or more, investing in a bond issue of less than $500 million presents a challenge. Very large managers want to own multiple hundreds of par value in individual names to “move the needle” and justify spending analytical time on the issuer. They could not amass such a large position in a small cap name without drastically pushing up their purchase price with large secondary market buys. They would accordingly have to make and manage many more such investments to deploy their assets in small issues, as opposed to taking larger positions in large cap issues. Given the scant information available in the small cap universe, these investments would also require a significantly higher level of manpower to research, price and monitor. That would neutralize the large economies of scale that drive the economics of managing a very large portfolio.
Conclusion
Investors price small issues as if they have substantiallygreater default risk and liquidity costs, but our research shows that the reverse has historically been true for default risk and that the incremental liquidity cost of holding small issues is trivial. In our experience, a large, enduring and exploitable inefficiency is a rare find in public security markets, as such inefficiencies are typically discovered and quickly arbitraged away. The small cap inefficiency persists because of the natural human response to unfamiliar risks confronted for the first time, the durability of the myth that small companies are riskier, the illusion of strength created by familiarity, the incorrect biases of the rating agencies and because large parts of the manager community have chosen to avoid small cap for their own institutional reasons.
These investments do come with risk, ofcourse. Without the support of plentiful information, consensus estimates and rich pricing comparisons, the skill, experience and track record of the manager come to the fore. In our view, investors interested in small cap high yield should look carefully at a potential manager’s approach to research, performance in down markets and track record before making a selection.