Milking the Protein Premium: Reshaping U.S. Dairy
Sep 2025
View available investments in your area

Sorry, we couldn't find any results matching
Please:

Over the past three decades, U.S. dairy production has consolidated rapidly, with production shifting to larger and larger herds. In 2022, 24,470 dairy farms were in operation in the U.S., down 95% from 648,000 in 1970. As a result, more than 60% of all milk production now occurs on farms with more than 2,500 cows.2 Bigger operations spread fixed costs across more cows and are far more likely to turn a profit than smaller dairies. That dynamic has fueled growth in thousand‑cow‑plus dairies and a steep decline in mid‑sized farms, especially in the Midwest and Northeast, though every region is trending larger. In 2021, over 60% of dairies with more than 2,000 cows were profitable, compared with between 20-30% of those with 100-199 cows.3 We expect consolidation to continue, albeit at a slower pace given current tailwinds.
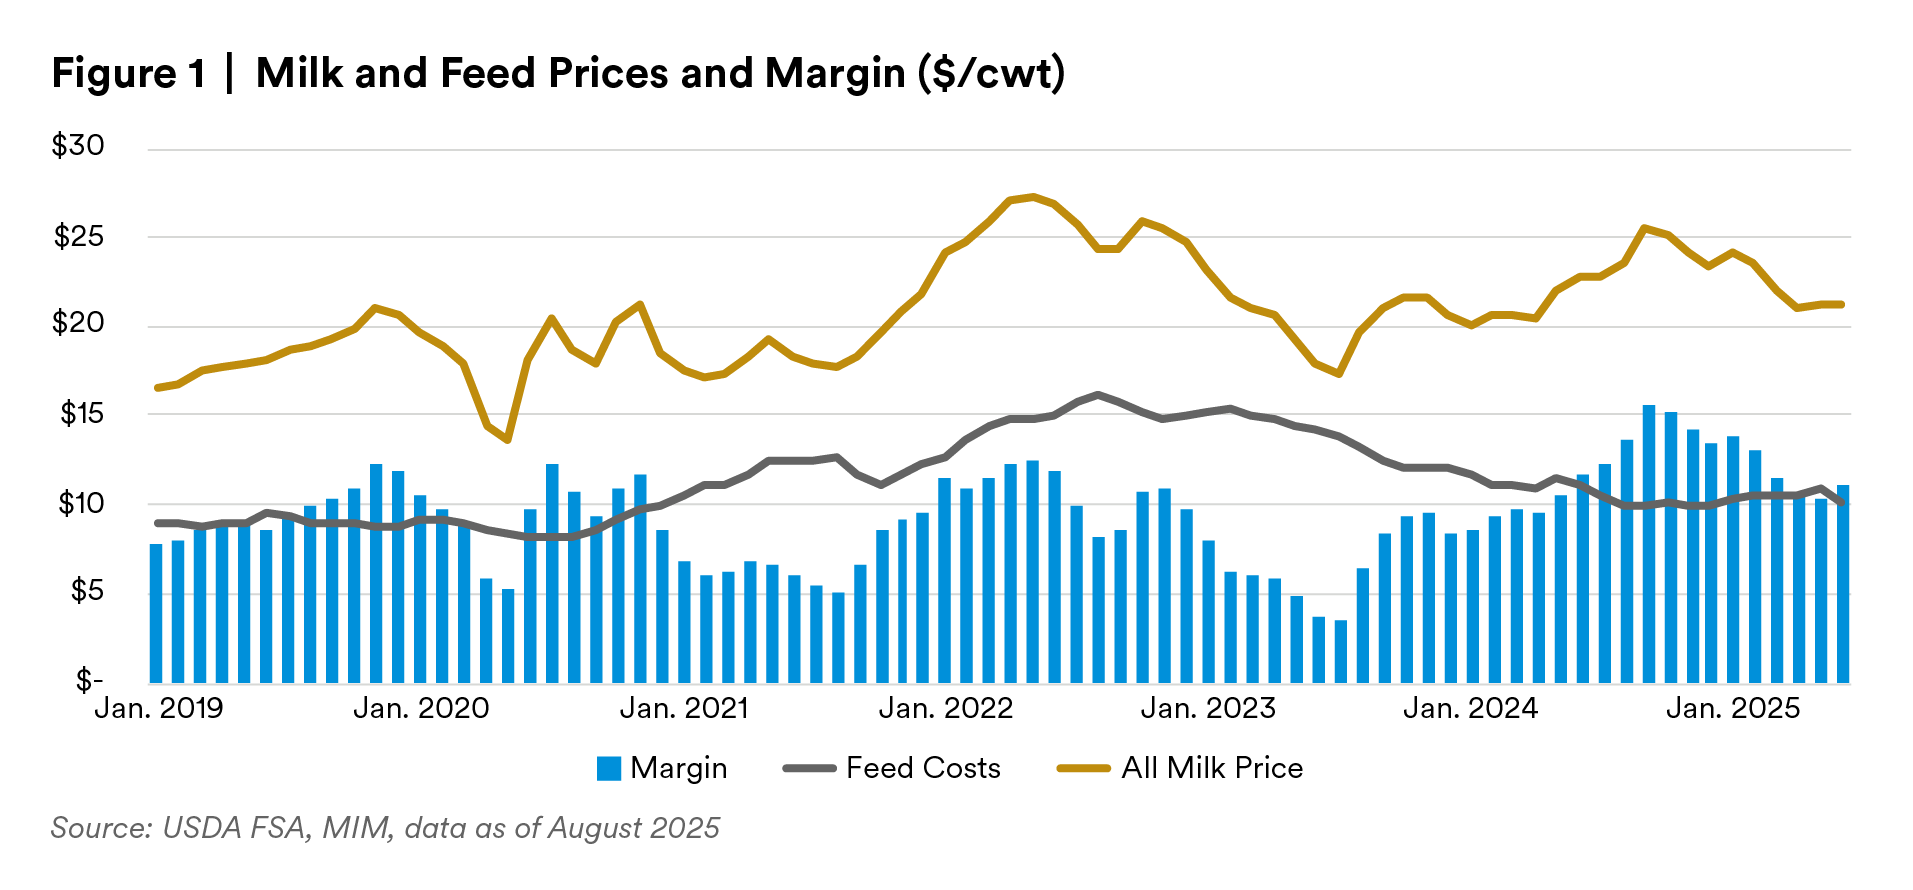
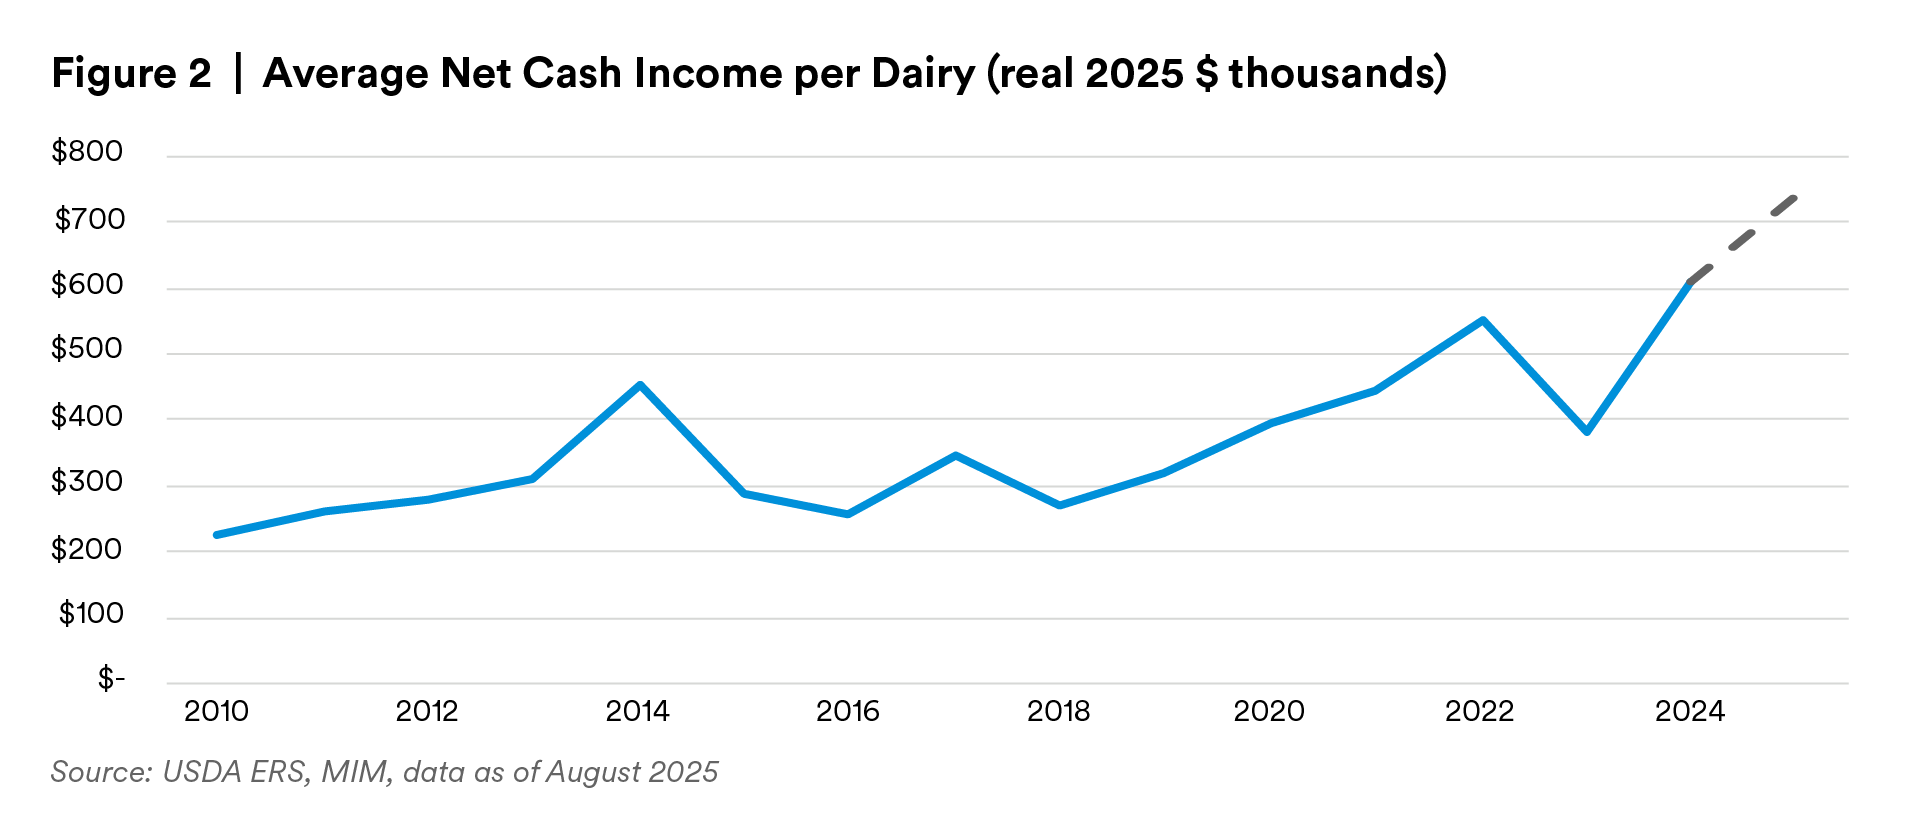
While milk prices have softened from record highs, lower feed costs have helped maintain producer profitability over the last year (See Figure 1). Average net cash income for dairy farms is projected to reach $743,900 per farm in 2025, the highest in the 16-year dataset (USDA ERS). Since 2020, average dairy farm income has surged, more than doubling from an inflation-adjusted $319,700 in 2019 (Figure 2).4 However, the sector has experienced notable income swings. For example, the industry saw record prices in late 2021-early 2022, immediately followed by softening milk prices and increasing operational costs that pushed margins to near break-even levels in 2023 (Figure 1), reinforcing the fact that the dairy market is volatile (Figure 2).
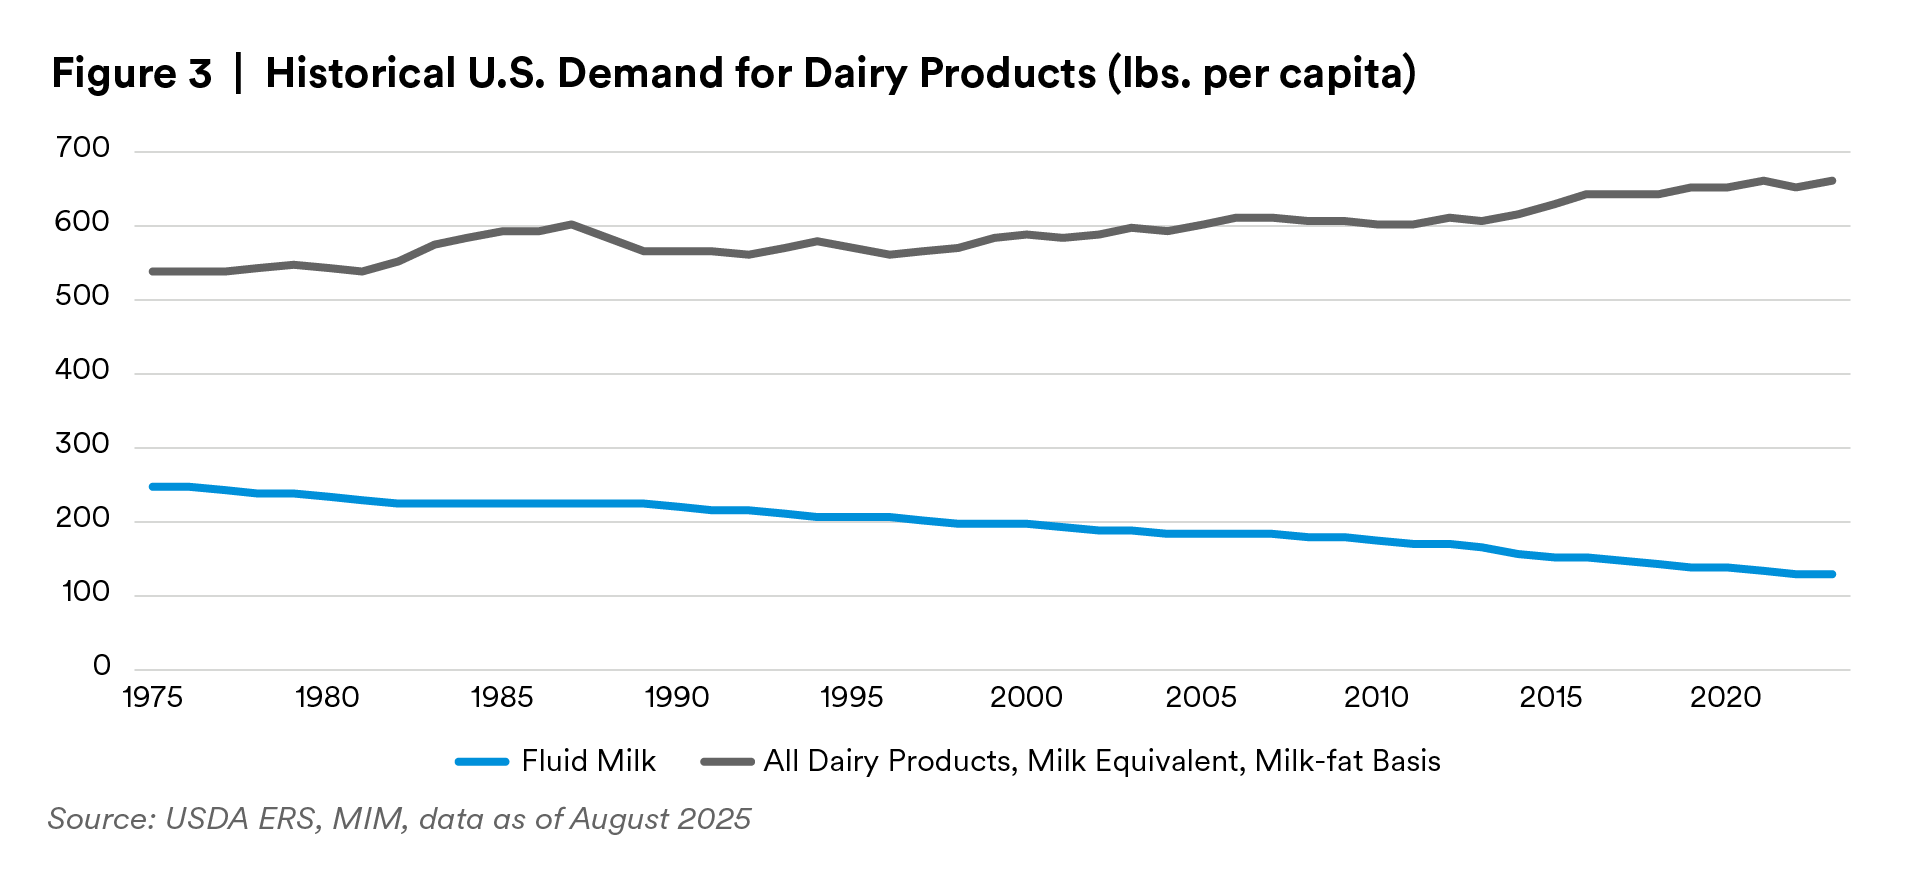
While per capita fluid milk consumption has roughly halved over the past 50 years, aggregate U.S. milk production and use have reached record levels5 driven by rising demand for value-added dairy products. On a milkfat-equivalent basis, total dairy consumption has increased nearly 23% over the long run, and per-capita consumption has risen about 12% since 2000 despite competition from plant-based alternatives (Figure 3). Growth has been led by cheese and butter and, more recently, by higher-value ingredients such as milk protein concentrate, whey protein concentrate and related milk product derivatives.
Milk protein concentrates such as whey and casein have moved from byproducts to versatile ingredients in yogurt, beverages, snacks and nutritional products. Producers are shifting from bulk powders to higher-value fractions to meet specialized demand. Rising consumer interest in protein, better processing technology and expanding trade support the trend. The milk protein market is projected to grow at 6-7% annually through 2030.7 Rapid adoption of GLP-1 medications such as Ozempic and Wegovy is also tilting preferences toward protein-dense, nutrient-rich, satiating options such as yogurt and cottage cheese.6 GLP-1 drug adoption increased 50.1% YoY to reach 8.3% of the U.S. population in July 2024 and is expected to reach 9% of the U.S. population by 2030, reinforcing the necessity and demand for protein-dense, portion-controlled foods.8,9
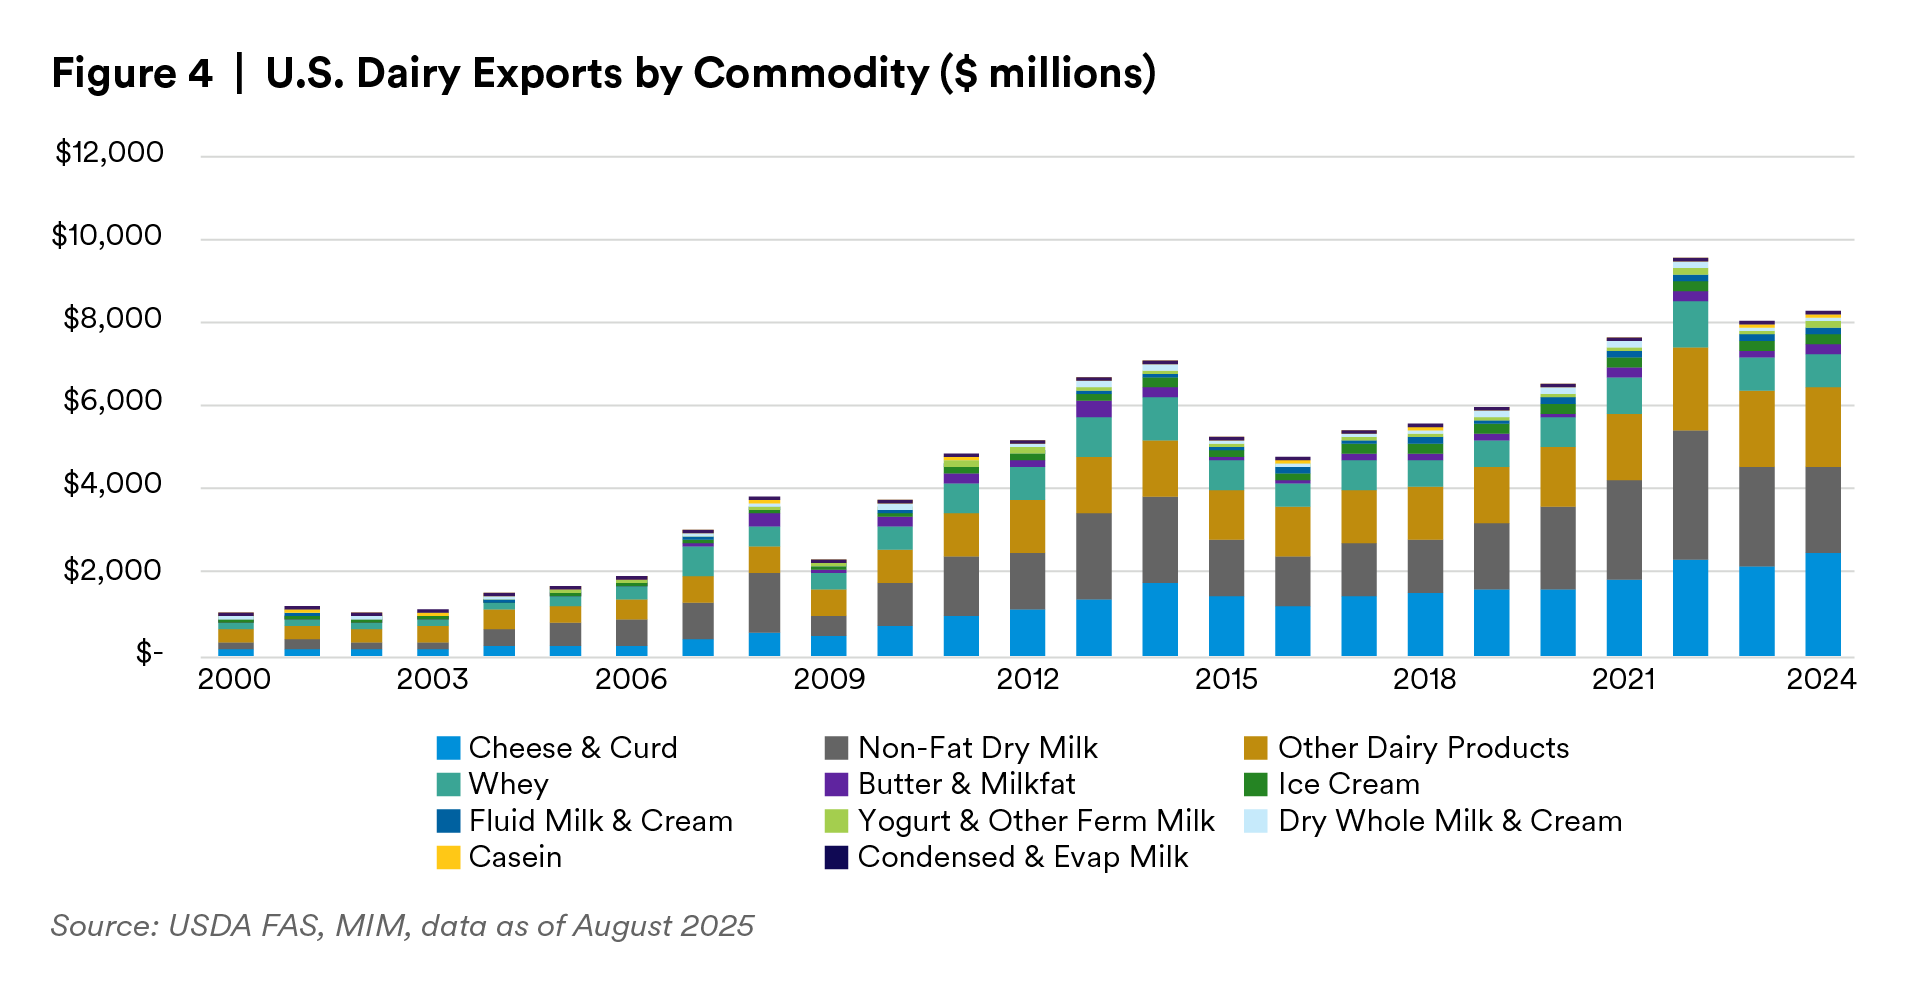
In terms of export demand, since 2000, both mix and volume have shifted toward value added, storable products. Cheese and curd, nonfat dry milk, butter and milkfat have grown in share and absolute output, with steady gains in whey, while fluid milk and other legacy categories are flat to down. Total exports have risen markedly, with step-ups after 2010 and new highs in the early 2020s (Figure 4). While the emphasis on ingredients that are easy to store and transport supports export growth and risk management, it also increases exposure to trade policy shifts, currency fluctuations and broader macroeconomic conditions.
More than 84% of agricultural producers and industry leaders reported a faster pace of technology adoption and productivity growth compared with the previous decade.10 The dairy sector stands to realize greater efficiency gains from technology than many other areas of agriculture. IoT monitoring, robotic milking and feeding, precision nutrition software and advanced analytics are turning dairies into data-driven operations. SenseHub collars track health and reproduction continuously; automated sort gates and milk meters route cows by need, while capturing yield and quality; and cloud platforms such as Pulse centralize herd data in real time. These tools raise fixed‑cost intensity and thus reinforce consolidation. Notably, 82% of dairy companies report higher efficiency after digital automation, and 40% of farms using robotic milking have lifted yields by up to 25%.11,12 By integrating sensors, automation and cloud analytics, producers are improving efficiency, animal welfare and profitability.13
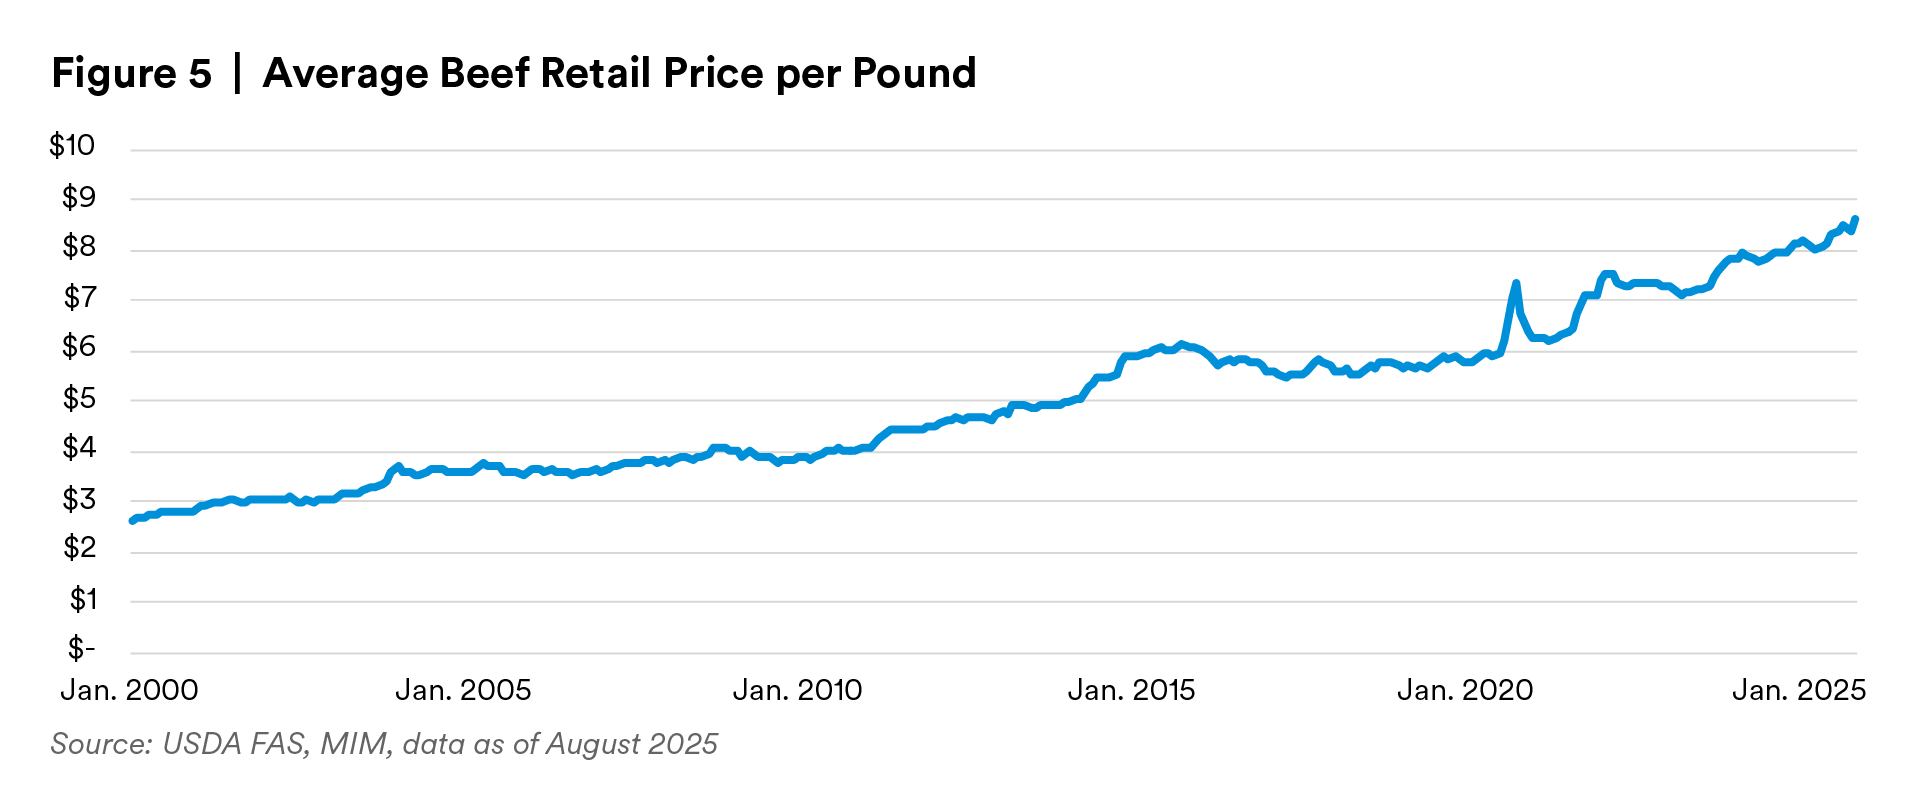
Another technological innovation is the rapid rise of “beef-on-dairy" genetics, with approximately 72% of U.S. dairy farms now incorporating beef genetics into their breeding programs. Historically, increasing efficiency in the dairy industry has meant consolidation, as high fixed costs made profitability largely dependent on herd expansion. However, the adoption of beef-on-dairy genetics has introduced a new pathway to efficiency and profitability. By using sexed semen, producers can selectively breed their highest-performing cows to produce replacement heifers, while breeding the remainder to beef bull breeds such as angus. This results in crossbred calves that command higher prices and are more desirable to feedlots, processors and consumers. Market demand for these beef-on-dairy animals has grown steadily, driven by their superior meat quality and yield compared to straight dairy breeds like Holsteins. As a result, beef-on-dairy genetics are not only adding to a diversifying income stream for dairy farms and allowing them to profit more from the current record high prices of beef (Figure 5), but also helping to bridge the gap in beef supplies left by a declining cattle inventory.15 In addition to using beef-on-dairy genetics to improve calf value, many producers are also breeding for higher milk protein by incorporating Jersey genetics. Jerseys produce less milk by volume but offer richer components, helping farmers meet rising demand for protein-heavy dairy products like cheese, yogurt and nutritional beverages.
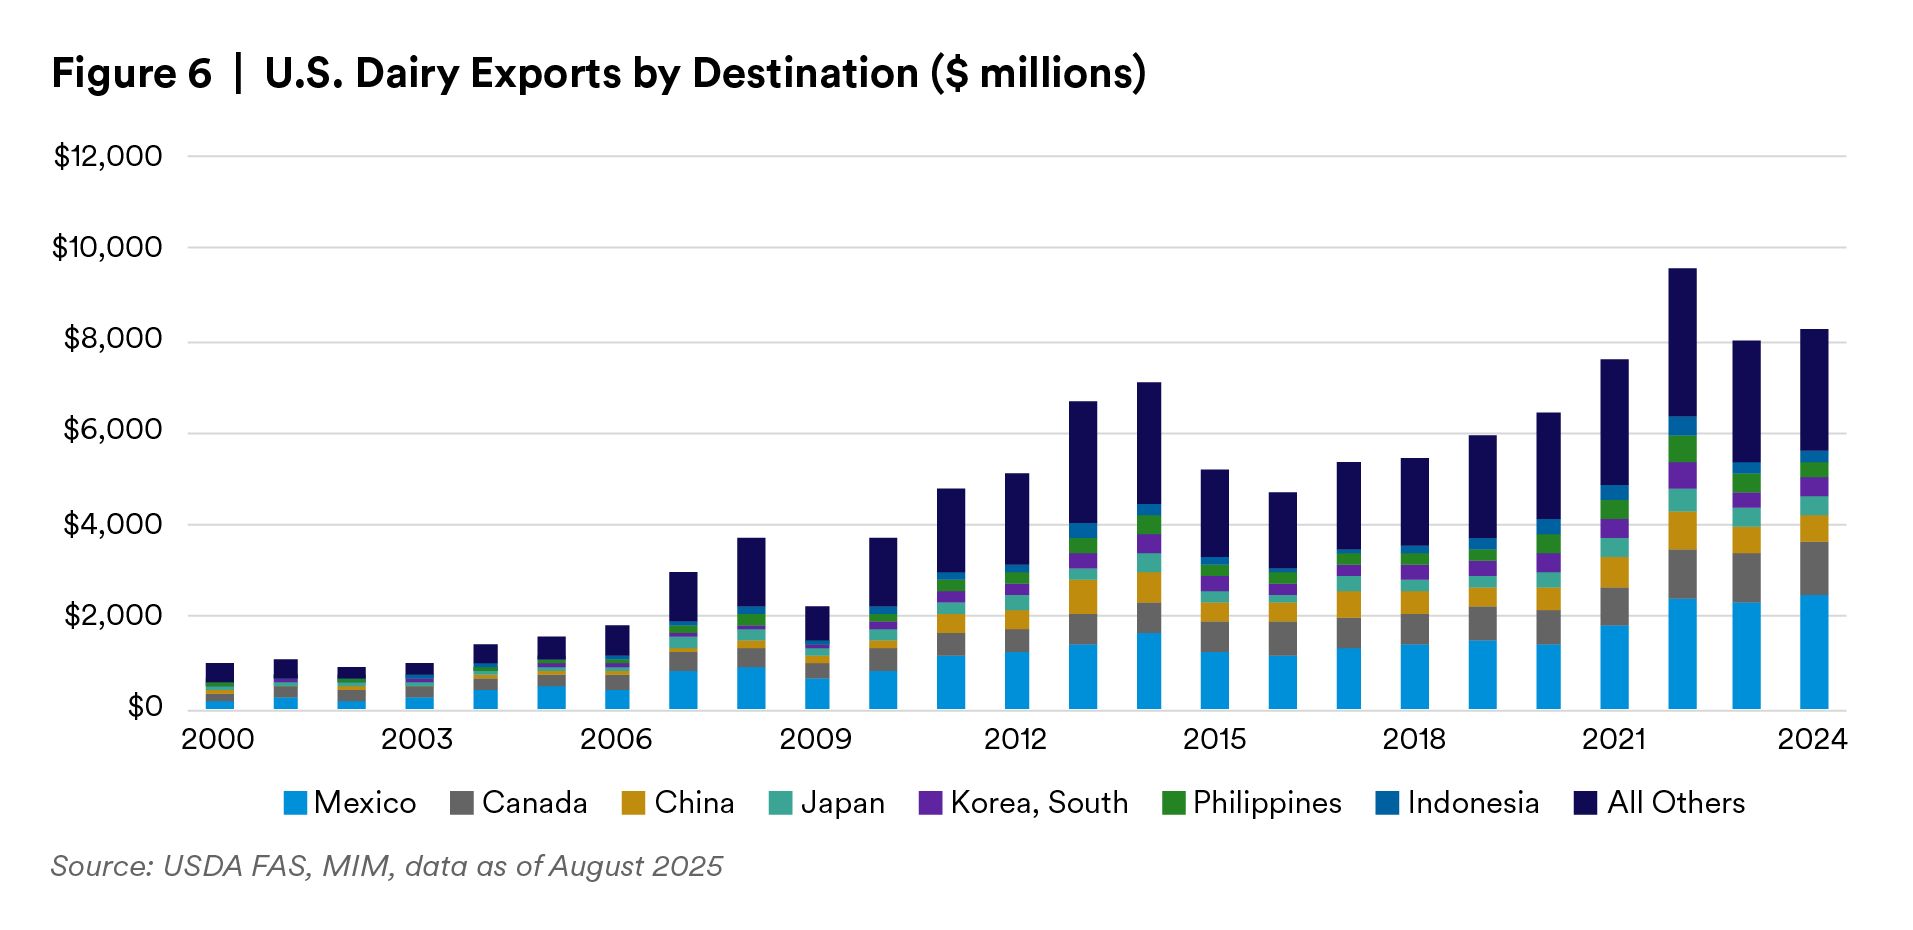
Access to export markets remains critical to industry profitability, as approximately 18% of U.S. milk production is sold abroad (primarily as milk products), with Mexico and Canada serving as key destinations (Figure 6). Trade disruptions, currency fluctuations or retaliatory tariffs could pressure prices and margins. Retaliatory tariffs from multiple major export destinations simultaneously would pose a downside risk to dairy — but retaliatory tariffs have been slow to materialize with the exception of China, and while Chinese tariffs are in effect, they have not shut down imports of U.S. dairy products like they have with soybeans. While past federal programs such as the 2019 Market Facilitation Program provided producer support of about $0.20 per cwt,16 comparable assistance is unlikely to reach processors downstream, leaving parts of the supply chain more exposed. A weakening macro environment could also prompt consumers to trade down from higher-priced proteins to lower-cost options. In addition, shifts related to GLP-1 usage and out-of-pocket costs may influence demand for specific protein formats and portion sizes, though the net effect on dairy is uncertain.
Additionally, the recent amendments to the Federal Milk Marketing Orders (FMMOs), effective June 2025, introduced several key changes, including higher skim milk composition factors, updated Class III and IV manufacturing allowances, and revised Class I differentials. The most notable adjustment is the return to the ‘higher-of’ formula for Class I pricing, which bases the price on the higher of the advanced Class III or Class IV skim milk prices rather than the previous average-based formula. While these updates aim to align pricing with current market conditions and improve processor cost recovery, the increase in make allowances (the estimated costs incurred by processors to convert raw milk into finished dairy products and is deducted from the milk price) is expected to reduce the prices paid to farmers, creating downward pressure on dairy producer margins despite overall modernization of the system.
Beyond trade and macro risks, several structural headwinds could constrain growth and profitability. Prices of labor, energy and other inputs remain elevated alongside high borrowing costs, keeping cost discipline front and center.
Environmental regulations on water use, methane and manure management are tightening, adding compliance costs and lengthening permitting timelines, while driving regional expansion in favorable jurisdictions. Competition from plant-based alternatives persists, especially among younger consumers in urban markets. Finally, evolving animal welfare standards, including Prop 12 style requirements adopted by retailers, may necessitate capital investment and operational changes, creating additional complexity to meet consumer demand. While immigration policy uncertainty remains a concern for agricultural labor markets, the impact varies across sectors. Dairy producers, though not immune, tend to be less exposed due to their reliance on permanent employees, a necessity driven by the daily, year-round nature of milking. This structural difference offers some buffer against the disruptions more commonly faced by crop sectors that depend heavily on seasonal migrant labor.
The U.S. dairy industry is positioned for continued growth, supported by structural efficiencies, evolving consumer preferences and innovations such as advanced automation and beef-on-dairy genetics. Economies of scale from consolidation, strong operating and financial management, and technological adoption are driving productivity gains, while demand for protein-rich, value-added products underpins long-term consumption trends both domestically and abroad. However, the sector remains exposed to international trade volatility of milk products and feed grains, macroeconomic pressures, regulatory shifts and competition from alternative proteins.
Endnotes
1 New Report Highlights Dairy’s Deep Economic Impact in Communities Across America - IDFA
2 2022 Census Volume 1, Chapter 1: U.S. National Level Data
3 Structure, Costs, and Technology Used on U.S. Dairy Farms
4 Farm Income and Wealth Statistics - Farm business average net cash income
5 Dairy Data | Economic Research Service
6 Milk Protein Market Size, Share, Trend | Industry Report 2030
7 How GLP-1 weight-loss drugs are redefining the dairy sector - Dairy Global
8 Expectations about GLP-1 Drugs Economic Impact on Food System Players
9 GLP-1 adoption and its impact on food demand
10 Food and Agriculture Economic Summit Highlights Factors Influencing Investment in Food Production and Distribution - Federal Reserve Bank of Kansas City
11 Digital Transformation In The Dairy Industry Statistics: Market Data Report 2025
12 Automatic Milking System Market Size, Share & Trends, 2025-2033
13 Digital Transformation In The Dairy Industry Statistics: Market Data Report 2025
14 Beefing Up Dairy: The Rise of Crossbreeding | Market Intel | American Farm Bureau Federation
15 The Growing Intersection of Dairy and Beef: How to Navigate Market Dynamics and Opportunities - Dairy Herd Management
16 Market Facilitation Program | Farm Service Agency