MetLife Retirement & Income Solutions
Market Commentary: The K-Shaped Economy Weighs on the U.S. Consumer
Feb 2026
MetLife Retirement & Income Solutions
Summary
We expect 2026 growth to be just marginally higher than 2025, driven by stable consumption and solid non-residential investment. We expect net exports to remain strong as U.S. businesses try to shift away from import-driven businesses. The labor market remains moribund; we believe both labor supply and demand will remain lackluster while remaining in a low-growth equilibrium.
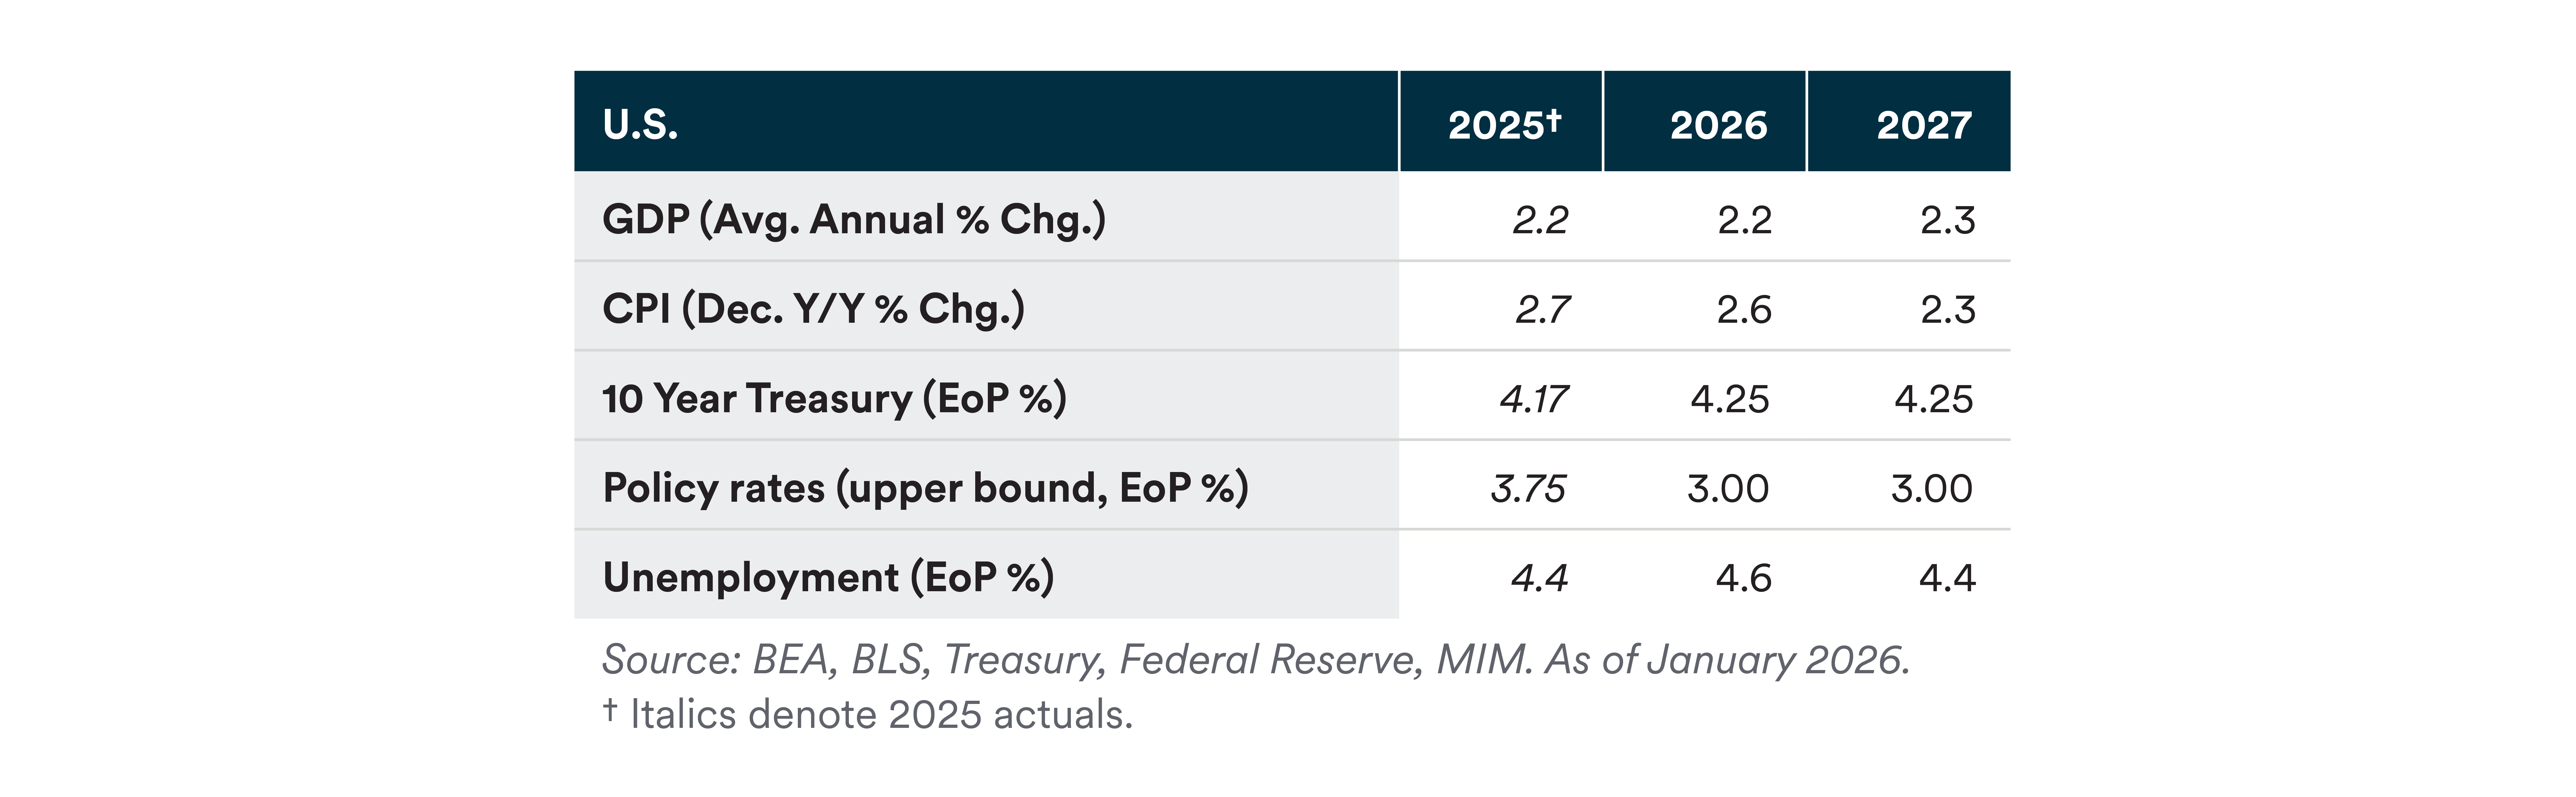
We anticipate inflation will keep falling, but headline CPI likely won’t hit 2% this year. Price shocks from tariffs appear to be partly behind us, but some pass-throughs are likely to continue in the first half of the year. Under an expected Fed Chair Kevin Warsh, we expect the Fed to cut rates by a total of 75 bps in 2026 given the ongoing weakness of labor market demand.
Risks
The most significant risk is a risk to the upside. With pressure on the Fed toward lower rates, tax refunds expected to be high, and perhaps other stimulus-type measures yet to come, there are several ways in which we may see an economy running relatively hot. Investments may create more jobs than we expect, reducing the need to cut rates.
Downside risks remain as valuations remain high, the lack of labor market dynamism weighs on optimism, and as wealthier consumers show signs of balance sheet strain.
Some risks are likely to be resolved in the first half of the year including the Supreme Court fights over IEEPA, the Trump administration’s attempt to dismiss Fed Governor Lisa Cook and prosecute Chair Powell. Other risks are likely to remain throughout the year, including those emanating from the suddenly active geopolitical tectonics. President Trump’s actions with respect to the U.S.’s influence over the Western Hemisphere, including its effect on Japan, Korea, and NATO all provide background tension.
Key Takeaways
Consumer spending makes up over two-thirds of U.S. GDP. We expect 2026 consumption to be stable and contribute to solid GDP growth but remain concerned about higher inequality and the growing share of spending coming from high-income consumers. We highlight three datapoints that show the K-shaped consumer trend. Recent data from the New York Federal Reserve shows that the lowest-income households can face inflation rates 10–15 basis points (bps) above the national average, while high-income households frequently experience rates below the national average. Middle-income households’ share of wealth also continues to fall and is now just over 25%. The lowest-income households have also faced consistently high earnings uncertainty after the pandemic.
A K-Shaped Inflation Experience
Consumers from different income cohorts face different levels of inflation. The latest data from the New York Fed’s Economic Heterogeneity Indicators (EHI) show that the bottom 40% of households have experienced persistently higher inflation than the national average in 2025. Meanwhile, in the last half of the year, the top 20% of households experienced less inflation than the national average.
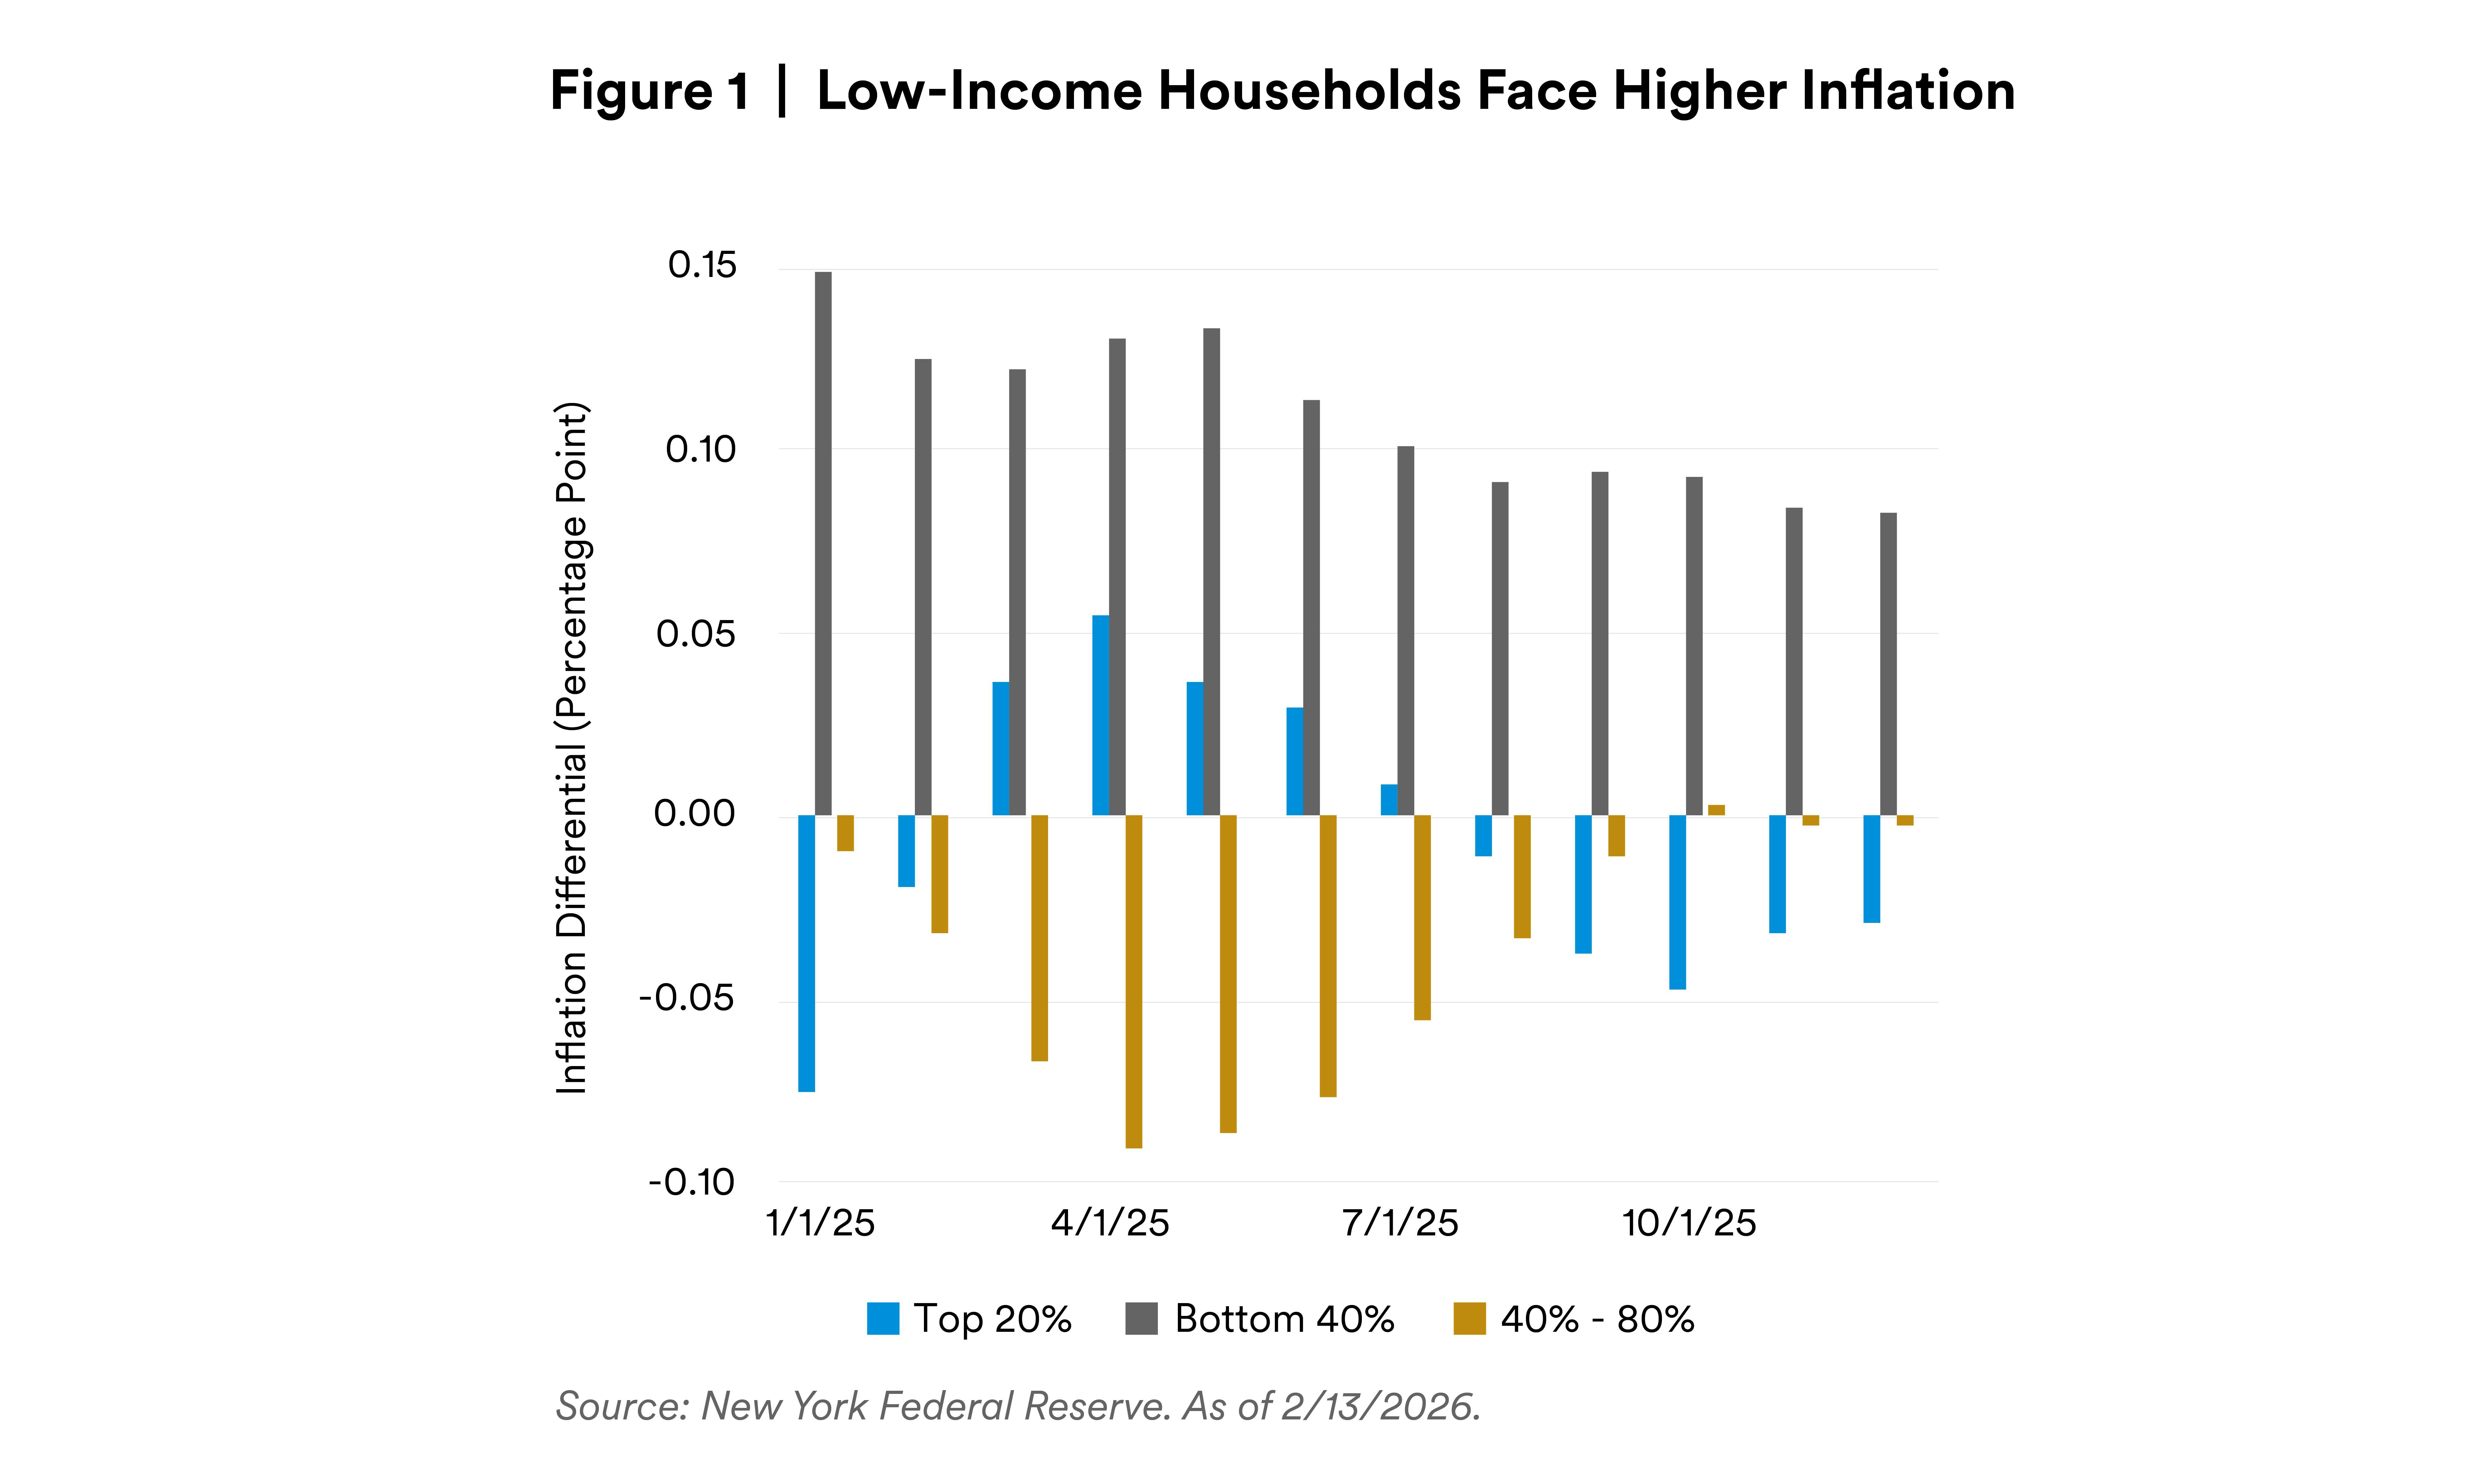
Regional differences also exist. Rural households faced higher inflation than urban households.
The inflation differential has implications for consumer spending: The EHI report also indicates that high-income consumers have increased their spending by more than middle- or low-income consumers. In fact, high-income consumers are the only group to show real spending increases since 2023. Middle-income real consumption was flat, and low-income real consumption declined.
We expect this trend to continue throughout 2026, with high-income consumers supporting consumption in GDP.
K-Shaped Share of Wealth
Even as high-income consumers continue to spend the most, their share of wealth continues to rise. The Fed’s distributional data show that the 80–100th percentile of households’ share of wealth has risen to 72%, while middle-income households’ share has fallen to just over 25%. The pandemic briefly reversed a longer-term trend of declining middle-class wealth, but that trend strongly reasserted itself in 2022. Higher-income households’ wealth has risen rapidly in part due to stronger equity and real estate prices.
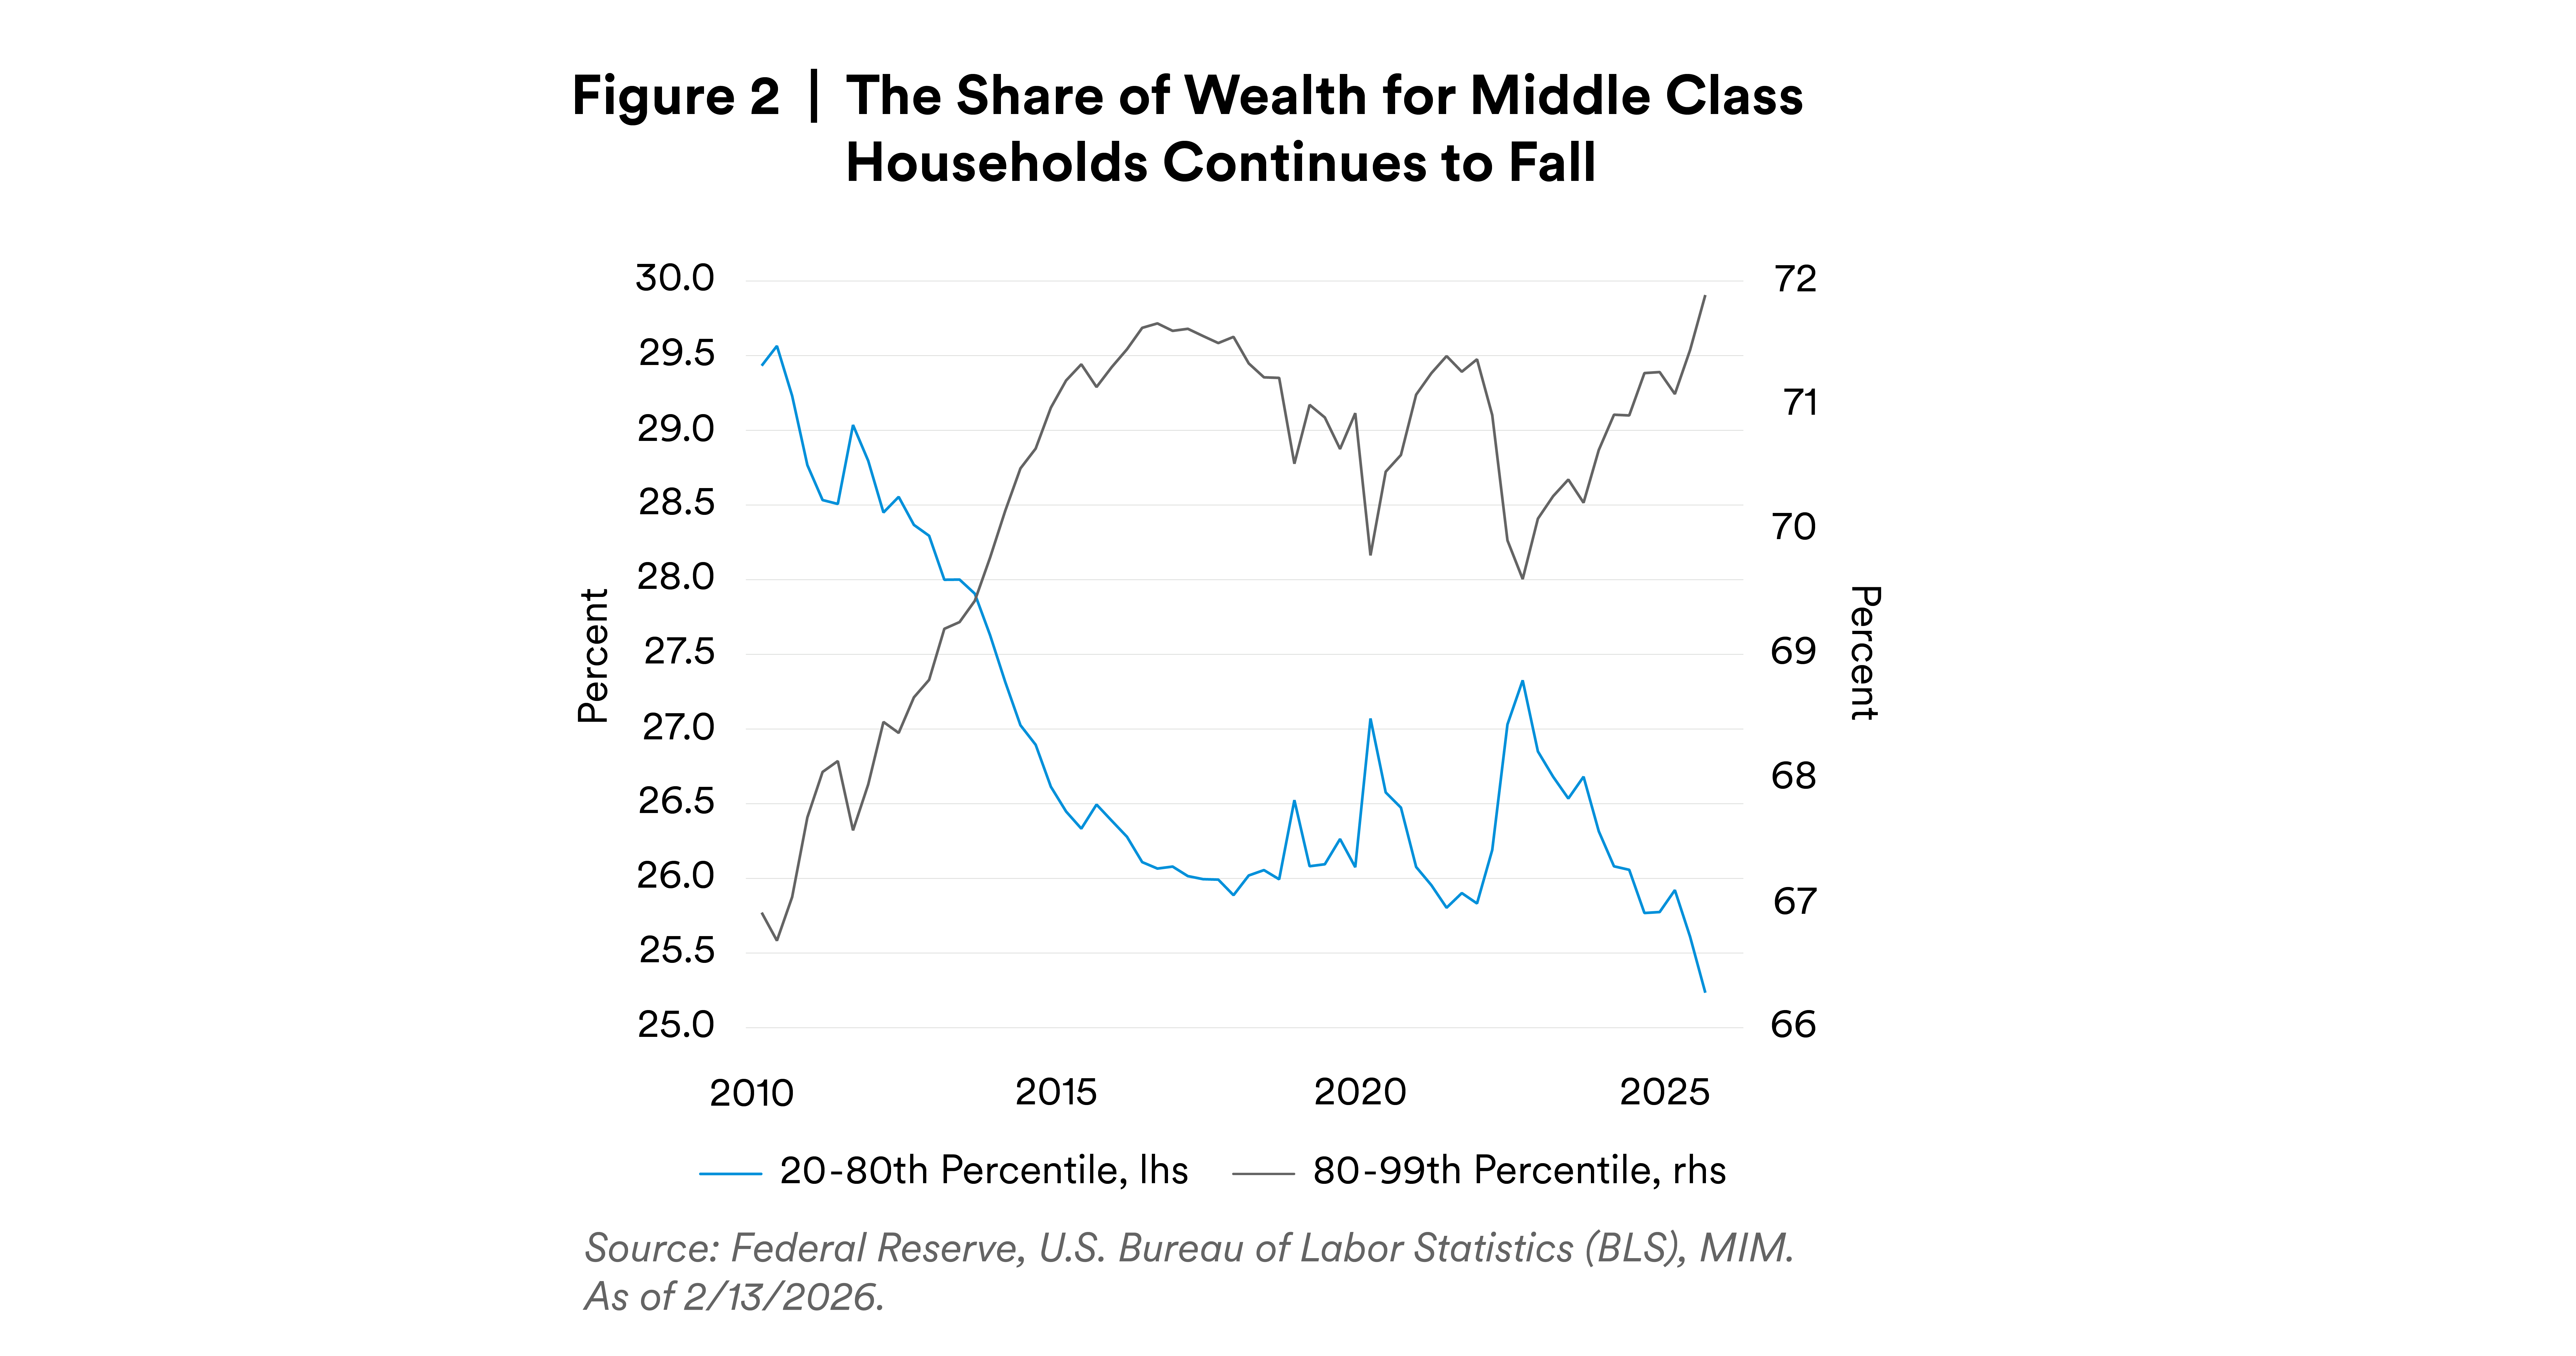
The lowest income households — those in the 0–20th percentile income groups — have a wealth share of just 3%.
Consumer spending is bolstered by high-income households in the short run, but it is important to monitor longer-term trends in inequality and middle-income wealth to understand the trajectory and stability of a large component of GDP.
K-Shaped Uncertainty
The New York Fed’s Survey of Consumer Expectations shows that earnings uncertainty has gone up across the board. Compared to pre-2022, earnings uncertainty for middle- and high-income households is marginally higher. But earnings uncertainty for households earnings less than $50,000 has skyrocketed and become more volatile.
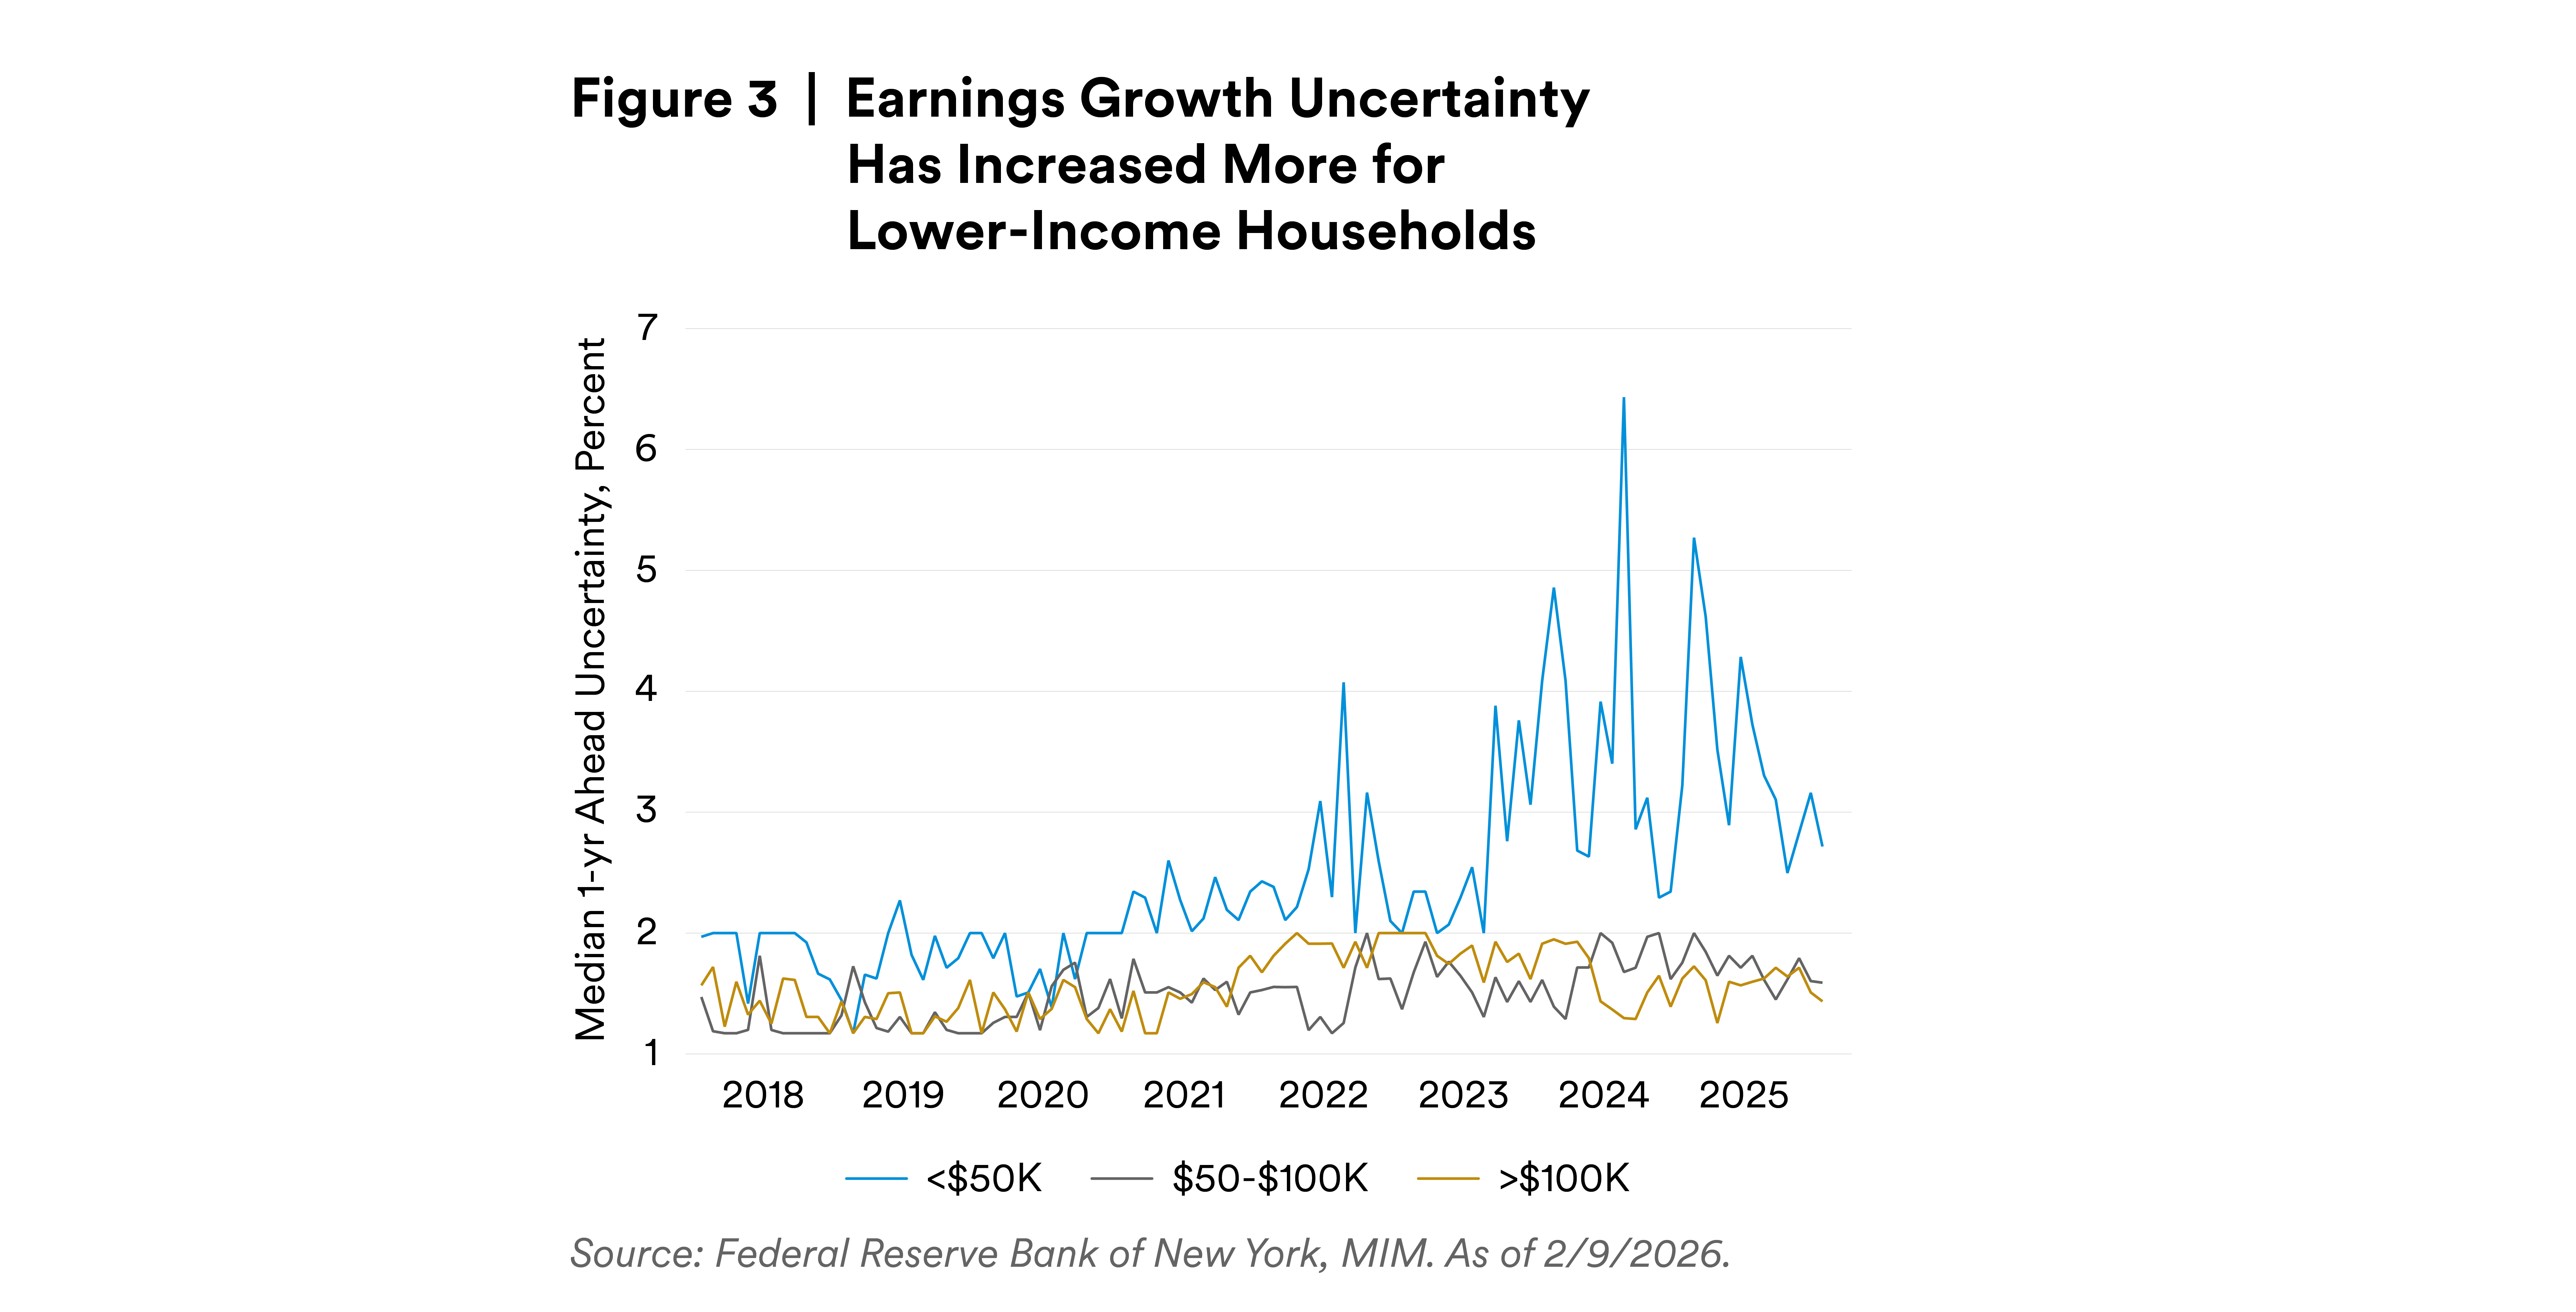
Alongside the earnings uncertainty, lower-income households also have lower expectations for earnings growth. The median low-income household expected earnings growth of just 1.4% in the next year, while high-income households continue to anticipate 3% or more.