With our purpose at our core—Always with you, building a more confident future—sustainability at MetLife means managing business responsibly and driving long-term value for our stakeholders.
Aligned with our New Frontier strategy, our sustainability efforts demonstrate how we live our purpose, generate meaningful impact and help deliver on the promises we make to our customers, people, communities and shareholders.
Living Our Purpose
Read our latest Sustainability Report for information on how we deliver value for all stakeholders.

Sustainability at MetLife
Environmental Stewardship
We leverage our capabilities as a financial services company to navigate life’s uncertainties, including those related to climate change and other environmental issues. Climate change poses a risk for our stakeholders, and because of this, we are working toward identifying solutions and building resiliency in a changing world.
Learn more about our environmental priorities:
- View our Global Environmental Policy Statement
- Read details on environmental topics, including nature & biodiversity; climate risk; deforestation; employee training & environmental engagement; environmental health & safety; green transportation; greenhouse gas emissions; green offices; green investments; Net Zero; renewable energy; supply chain sustainability; sustainable travel; waste management; and water management.
- Review our latest sustainability framework disclosure.

Sustainability at MetLife
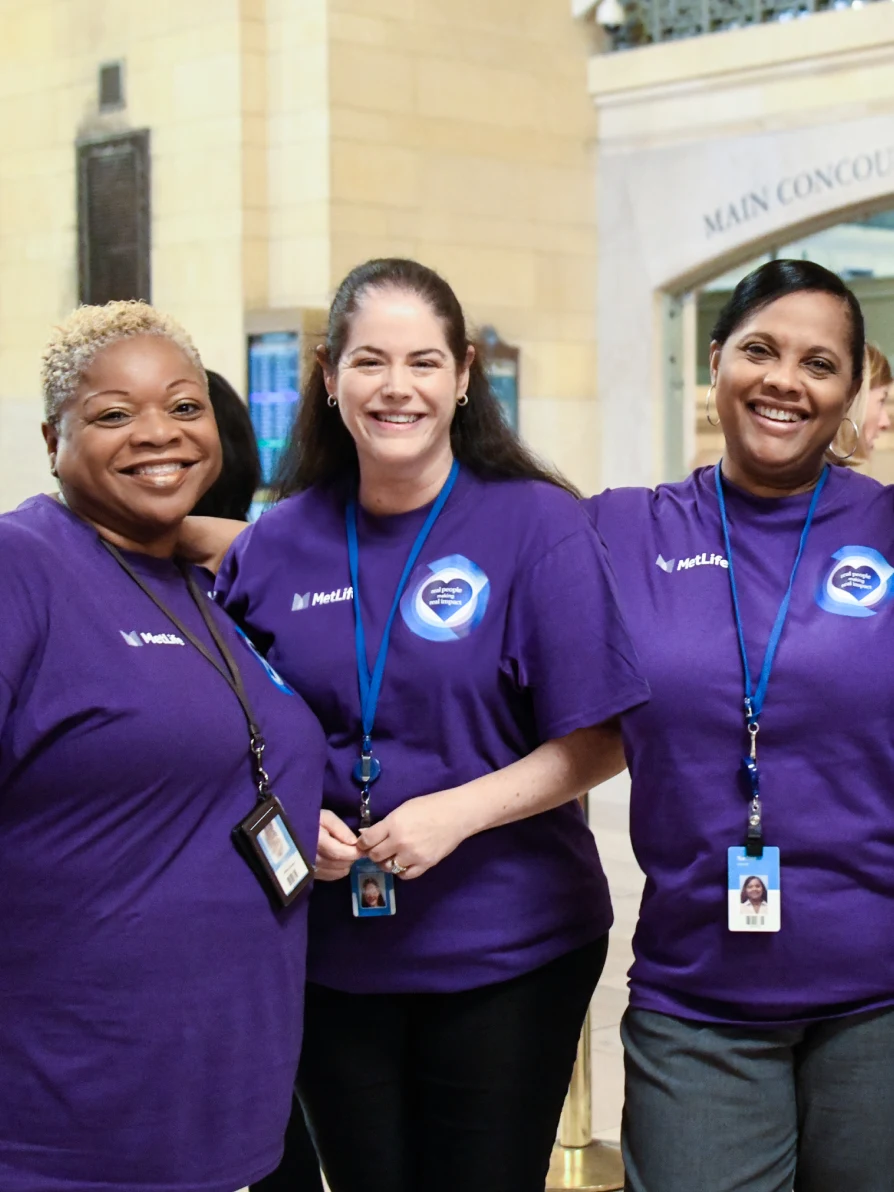
Social Responsibility
Through product innovation, the work of MetLife Foundation, our corporate giving, employee volunteering efforts and pro bono services, MetLife employees work every day to help build a more confident future for people around the world.
Learn more about our social priorities:
- View how MetLife Foundation is driving inclusive economic mobility by addressing the needs of people with low income around the world.
- Read details on social topics including: benefits & compensation; community relations; culture of inclusion; employee volunteerism; sustainability products & services; financial wellness; health & wellness; healthy workplace; human rights; impact investments; pay equity; supplier inclusion; and talent & skill development.

Sustainability at MetLife
Corporate Governance
MetLife is committed to conducting business fairly and transparently to meet the highest professional standards while navigating an ever-changing external environment.
Learn more about our governance priorities:
- Review our commitment to responsible corporate governance.
- Explore our Code of Business Ethics.
- See additional policies, resources and codes related to various sustainability topics.
- Read details on governance topics, including anti-bribery & corruption; anti-money laundering policy; antitrust guidelines; Board oversight and composition; business ethics and values; conflict of interest and outside activity; cybersecurity; executive compensation; global sales practices policy; privacy & data security; public policy; responsible AI; responsible investments; risk management; shareholder engagement; sustainable financing framework; and whistleblowing.
Sustainability at MetLife
Our Sustainability Aspirations
MetLife’s New Frontier Sustainability Aspirations support our strategy and make sure our progress has a positive impact for all. Our Aspirations focus on two areas—Employee Engagement and Climate.
View MetLife's performance data across environmental, social and governance indicators.
2025 Sustainability Scorecard
2025 Sustainability Report
Living Our Purpose
Read our 2025 Sustainability Report for more information on MetLife initiatives and progress.
Living Our Purpose
Read our 2025 Sustainability Report for more information on MetLife initiatives and progress.
Download Report
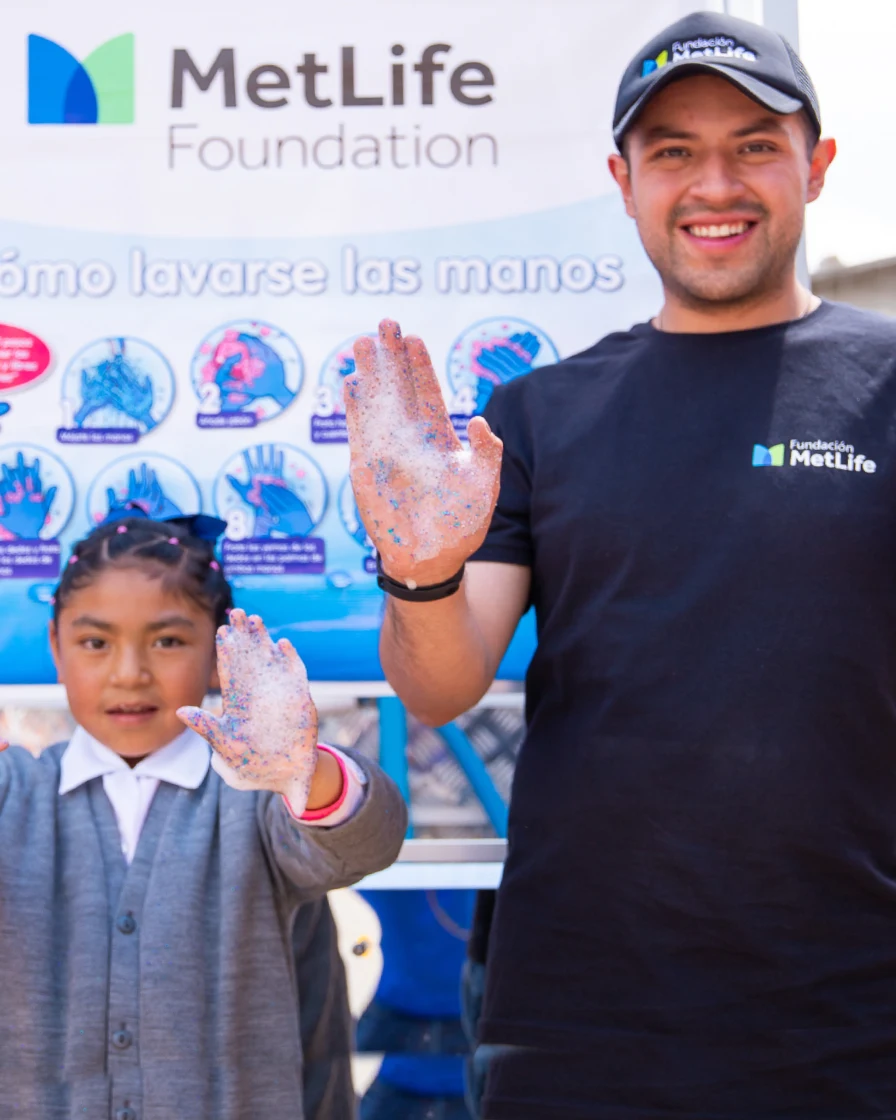
MetLife Foundation
MetLife Foundation supports communities by connecting MetLife employees with nonprofit partners addressing important issues and opportunities for volunteerism, pro-bono work and grantmaking.
Careers at MetLife
If you are looking for a workplace where collaboration knows no bounds, every voice is valued, and innovation is fueled, MetLife is for you.